1. Support and Resistance Reliability
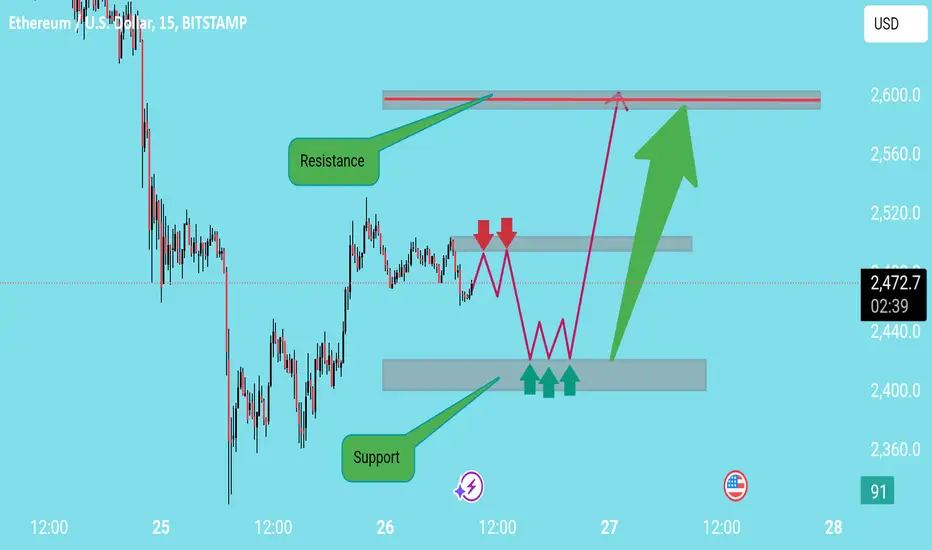
The analysis assumes a strong support zone at the lower level and a firm resistance at the top.
However, support and resistance levels are not static—they can be invalidated if momentum is strong
If the price revisits support too many times, it could break down instead of bouncing.
2. Repetitive Range-Bound Expectation
The chart predicts multiple rejections at the middle resistance before a breakout.
Markets don’t always behave in such a predictable pattern—sideways action could lead to a sudden breakdown instead of a breakout.
3. Lack of Volume & Trend Confirmation
There's no volume analysis to confirm if support and resistance levels are strong.
A higher time frame (1H or 4H) analysis would help validate if this is just consolidation or a genuine trend reversal.
4. Breakout vs. Fakeout Possibility
The projection assumes a clean breakout above resistance.
However, many breakouts turn into fakeouts, where price moves above resistance, traps buyers, and then reverses sharply.
A liquidity grab above resistance could lead to a drop instead of a rally.
Alternative Perspective
Instead of assuming a clear upward movement, consider two scenarios:
1. Bullish Case: If volume supports the breakout, enter after a successful retest of resistance as support.
2. Bearish Case: If the breakout fails (fakeout), expect a retest and breakdown, leading to a lower support level
Telegram t.me/zumxau
Disclaimer
The information and publications are not meant to be, and do not constitute, financial, investment, trading, or other types of advice or recommendations supplied or endorsed by TradingView. Read more in the Terms of Use.
Telegram t.me/zumxau
Disclaimer
The information and publications are not meant to be, and do not constitute, financial, investment, trading, or other types of advice or recommendations supplied or endorsed by TradingView. Read more in the Terms of Use.