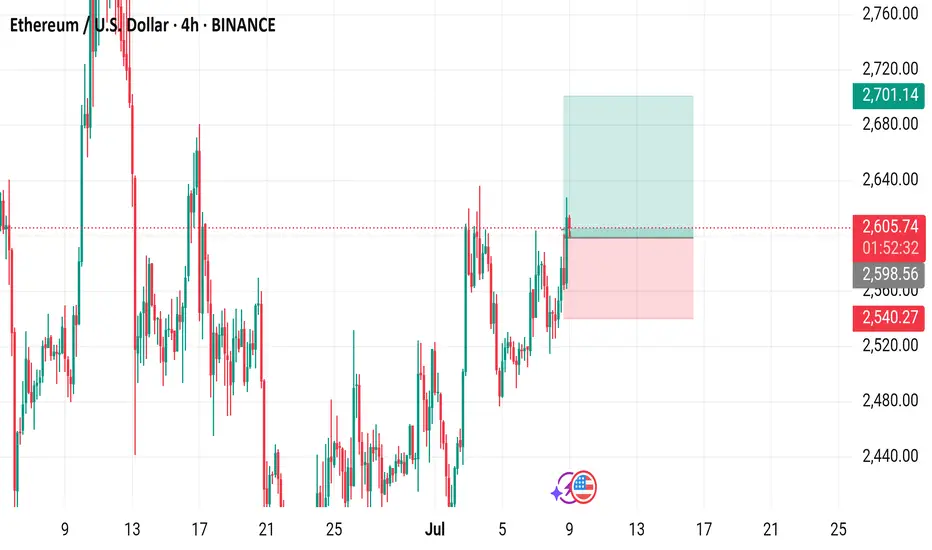
4-hour candlestick chart from Binance displays the price movement of Ethereum (ETH) against the U.S. Dollar (USD) from late June to early July 2025. The current price is $2,608.76, reflecting a +$65.53 (+2.58%) change. The chart includes buy and sell indicators at $2,608.76, with a highlighted resistance zone around $2,700-$2,760 and a support zone around $2,540-$2,600. The chart also shows a recent upward trend with fluctuating volatility.
Trade closed: target reached
Perfect target achieved Daily XAU/USD FREE setups | Let's grow together!
| XAU/USD Trader | Telegram: https://t.me/Aleegoldsignals
| XAU/USD Trader | Telegram: https://t.me/Aleegoldsignals
Disclaimer
The information and publications are not meant to be, and do not constitute, financial, investment, trading, or other types of advice or recommendations supplied or endorsed by TradingView. Read more in the Terms of Use.
Daily XAU/USD FREE setups | Let's grow together!
| XAU/USD Trader | Telegram: https://t.me/Aleegoldsignals
| XAU/USD Trader | Telegram: https://t.me/Aleegoldsignals
Disclaimer
The information and publications are not meant to be, and do not constitute, financial, investment, trading, or other types of advice or recommendations supplied or endorsed by TradingView. Read more in the Terms of Use.