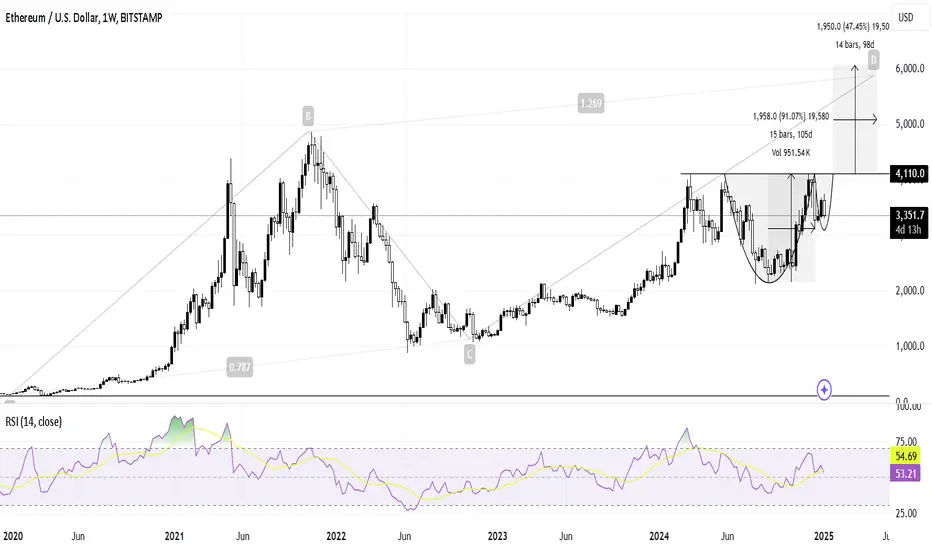
ETH is gearing up for a bull run!
Monthly Chart: An ABCD pattern indicates a price projection around $6,000.
Daily & Weekly Charts: A bullish continuation pattern (Cup and Handle) supports the same target of $6,000.
Strategy:
Buy the dip and hold.
Alternatively, wait for a breakout above $4,110 for confirmation.
Monthly Chart: An ABCD pattern indicates a price projection around $6,000.
Daily & Weekly Charts: A bullish continuation pattern (Cup and Handle) supports the same target of $6,000.
Strategy:
Buy the dip and hold.
Alternatively, wait for a breakout above $4,110 for confirmation.
Disclaimer
The information and publications are not meant to be, and do not constitute, financial, investment, trading, or other types of advice or recommendations supplied or endorsed by TradingView. Read more in the Terms of Use.
Disclaimer
The information and publications are not meant to be, and do not constitute, financial, investment, trading, or other types of advice or recommendations supplied or endorsed by TradingView. Read more in the Terms of Use.