Hello Everyone, I am LiquidMex here to share my opinion on the weekly Ethereum chart.
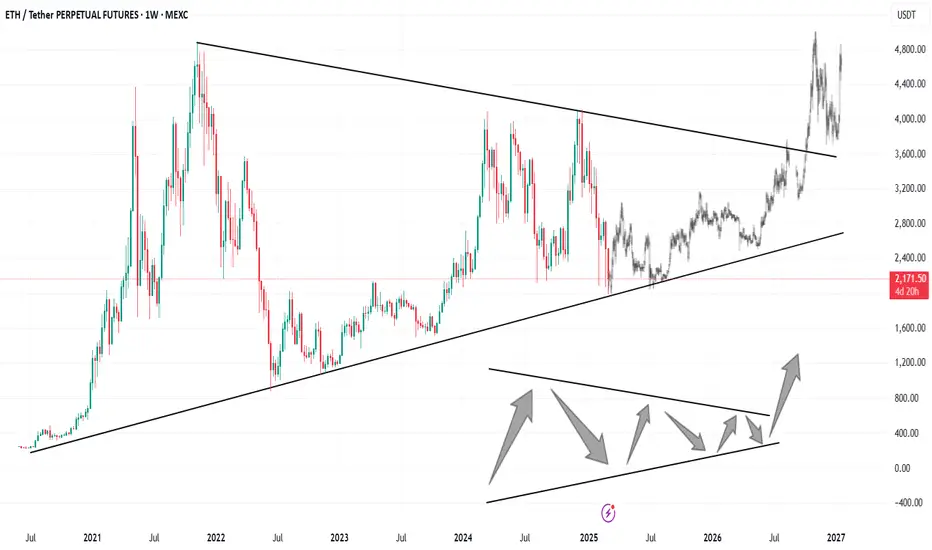
What is a symmetrical triangle?!?
A symmetrical triangle is a common chart pattern in technical analysis. It occurs when the price of an asset fluctuates within a narrow range, forming two converging trendlines. The upper trendline connects a series of lower highs, while the lower trendline joins a sequence of higher lows
As the price of Eth declines so does the chance of Ethereum recovering to break all-time highs, President Trump announced a Crypto Reserve listing Ethereum as one of the 5 coins in the Crypto reserve. We saw a nice pump in price the day of announcing the Crypto Reserve followed by a continuation of a sell off.
Key level of support $1,980
The Key level to stay above is around $1,980 breaking below that key level would result in a crash ultimately down to the $1,500's
This key level of support is critical that it holds as if it does hold i would assume in the chart depicted above we would create a Symmetrical Triangle. I would expect Ethereum to have a breakout of the symmetrical triangle within the next 500 days.
Currently the overall crypto markets look uncertain i personally believe we have started a 1.5 year bear market i don't think we will go much lower but i do believe there will be alot of sideways price action for months to come.
If you found value in my technical analysis Ethereum make sure to smash that like button and give me a follow.
Disclaimer
The information and publications are not meant to be, and do not constitute, financial, investment, trading, or other types of advice or recommendations supplied or endorsed by TradingView. Read more in the Terms of Use.
Disclaimer
The information and publications are not meant to be, and do not constitute, financial, investment, trading, or other types of advice or recommendations supplied or endorsed by TradingView. Read more in the Terms of Use.