Technical Analysis of Ethereum (ETH/USDT) by Blaž Fabjan
Technical Analysis of Ethereum (ETH/USDT)
Chart Overview:
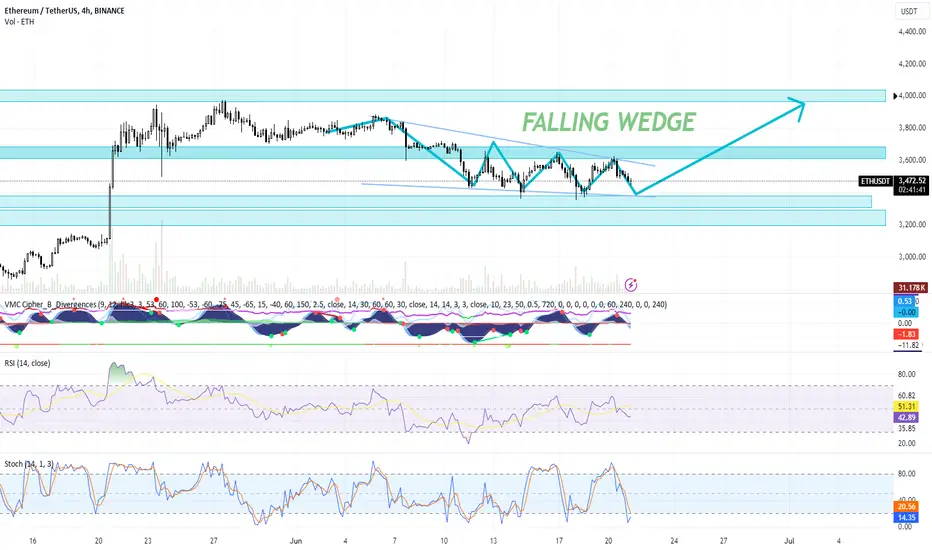
The chart depicts the ETH/USDT price action on a 4-hour timeframe, showcasing a falling wedge pattern, which is generally considered a bullish reversal pattern. Here are the key observations:
Falling Wedge Pattern:
The falling wedge is marked clearly, indicating a potential upward breakout. The pattern is confirmed by the higher lows and lower highs converging towards the apex.
Support and Resistance Levels:
Resistance Zones: $3,600 - $3,800 and $4,000.
Support Zones: $3,200 - $3,400.
Volume: The volume is relatively low but picking up near support zones, which is a typical characteristic before a breakout.
Indicators:
VMC Cipher B: Showing potential divergences with green dots indicating possible bullish momentum.
RSI (14): Currently at 42.06, suggesting the market is not overbought and has room to move up.
Stochastic RSI: Showing oversold conditions, which could indicate a buying opportunity as it crosses upwards.
Trading Plan
Intraday Trading
Strategy: Use support and resistance levels for quick trades.
Entry: Buy near the support zone ($3,200 - $3,400) when confirmed by bullish indicators (e.g., green dots on VMC Cipher B).
Target: Sell near the first resistance zone ($3,600 - $3,800).
Stop Loss: Place a stop loss below $3,200 to manage risk.
Scalping
Strategy: Take advantage of small price movements within the support and resistance zones.
Entry: Buy on minor pullbacks within the wedge near $3,300 - $3,400.
Target: Aim for small profits at $3,450 - $3,500.
Stop Loss: Place tight stop losses around $3,280 to minimize losses on quick trades.
Swing Trading
Strategy: Capitalize on the potential breakout from the falling wedge.
Entry: Buy once price breaks and retests the upper trendline of the wedge around $3,500 with confirmation from volume increase.
Target: First target at $3,800, with a potential move to $4,000.
Stop Loss: Place a stop loss below the retest level, around $3,400.
Conclusion and Advice
Given the technical indicators and the falling wedge pattern, Ethereum (ETH) is showing signs of a bullish reversal. Traders should consider the following:
Long Positions: Favorable for all trading strategies (intraday, scalping, and swing trading) as the pattern and indicators suggest an upward movement. Enter positions near support levels and on confirmed breakouts.
Short Positions: Not advisable at this stage unless there's a confirmed breakdown below the support zone of $3,200, which could invalidate the bullish pattern.
Recommendation: Based on the chart, a long position is recommended with careful attention to the support and resistance levels. Monitor the indicators for any shifts in momentum and adjust the trading strategy accordingly. Always use stop losses to manage risk effectively.
Chart Overview:
The chart depicts the ETH/USDT price action on a 4-hour timeframe, showcasing a falling wedge pattern, which is generally considered a bullish reversal pattern. Here are the key observations:
Falling Wedge Pattern:
The falling wedge is marked clearly, indicating a potential upward breakout. The pattern is confirmed by the higher lows and lower highs converging towards the apex.
Support and Resistance Levels:
Resistance Zones: $3,600 - $3,800 and $4,000.
Support Zones: $3,200 - $3,400.
Volume: The volume is relatively low but picking up near support zones, which is a typical characteristic before a breakout.
Indicators:
VMC Cipher B: Showing potential divergences with green dots indicating possible bullish momentum.
RSI (14): Currently at 42.06, suggesting the market is not overbought and has room to move up.
Stochastic RSI: Showing oversold conditions, which could indicate a buying opportunity as it crosses upwards.
Trading Plan
Intraday Trading
Strategy: Use support and resistance levels for quick trades.
Entry: Buy near the support zone ($3,200 - $3,400) when confirmed by bullish indicators (e.g., green dots on VMC Cipher B).
Target: Sell near the first resistance zone ($3,600 - $3,800).
Stop Loss: Place a stop loss below $3,200 to manage risk.
Scalping
Strategy: Take advantage of small price movements within the support and resistance zones.
Entry: Buy on minor pullbacks within the wedge near $3,300 - $3,400.
Target: Aim for small profits at $3,450 - $3,500.
Stop Loss: Place tight stop losses around $3,280 to minimize losses on quick trades.
Swing Trading
Strategy: Capitalize on the potential breakout from the falling wedge.
Entry: Buy once price breaks and retests the upper trendline of the wedge around $3,500 with confirmation from volume increase.
Target: First target at $3,800, with a potential move to $4,000.
Stop Loss: Place a stop loss below the retest level, around $3,400.
Conclusion and Advice
Given the technical indicators and the falling wedge pattern, Ethereum (ETH) is showing signs of a bullish reversal. Traders should consider the following:
Long Positions: Favorable for all trading strategies (intraday, scalping, and swing trading) as the pattern and indicators suggest an upward movement. Enter positions near support levels and on confirmed breakouts.
Short Positions: Not advisable at this stage unless there's a confirmed breakdown below the support zone of $3,200, which could invalidate the bullish pattern.
Recommendation: Based on the chart, a long position is recommended with careful attention to the support and resistance levels. Monitor the indicators for any shifts in momentum and adjust the trading strategy accordingly. Always use stop losses to manage risk effectively.
Disclaimer
The information and publications are not meant to be, and do not constitute, financial, investment, trading, or other types of advice or recommendations supplied or endorsed by TradingView. Read more in the Terms of Use.