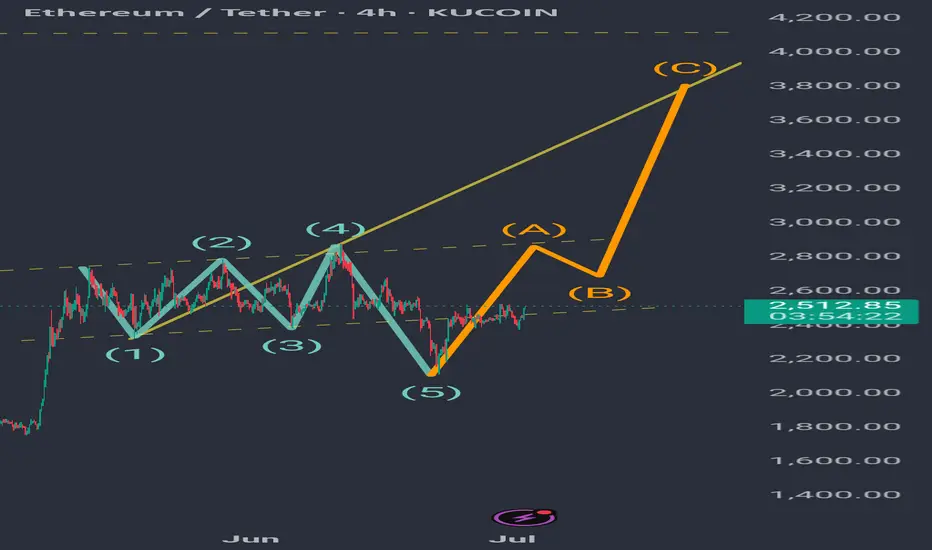
Eth hit a low near $1,400 in early April and from there charted a sharp rise, doubling its price. Around $2,800, it clearly encountered resistance corresponding to the 0.5 Fibonacci of the previous downward movement. From that point, it moved sideways in a range whose downward breakout reached the 0.5 Fibonacci of the current upward movement, $2,113, where it found strong support and has returned to the range. So far, this appears to be forming a bullish Wolve wave, whose target would be reached at the yellow line, which is the projection of waves 1 and 4 connecting. If Eth manages to break through the range and consolidate above it, it is very likely to achieve that target.
Disclaimer
The information and publications are not meant to be, and do not constitute, financial, investment, trading, or other types of advice or recommendations supplied or endorsed by TradingView. Read more in the Terms of Use.
Disclaimer
The information and publications are not meant to be, and do not constitute, financial, investment, trading, or other types of advice or recommendations supplied or endorsed by TradingView. Read more in the Terms of Use.