Hello crypto community!
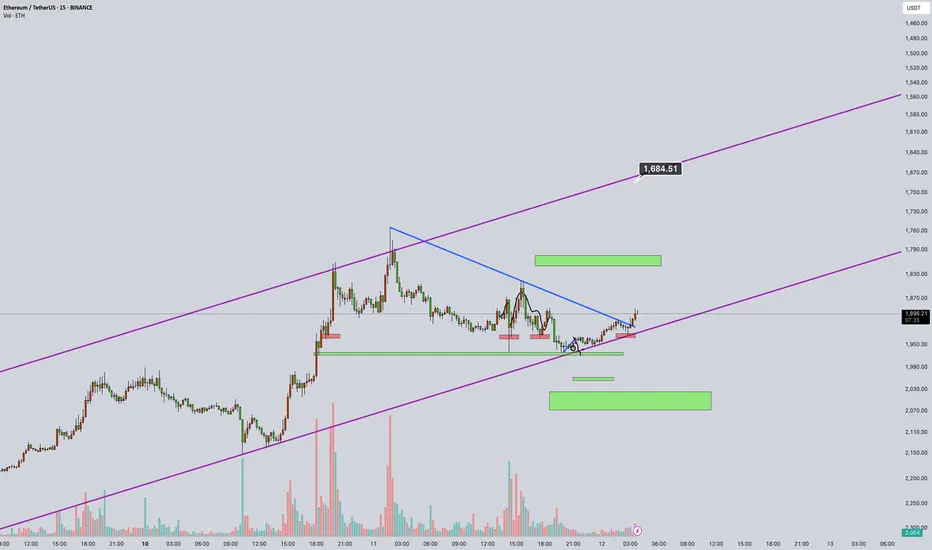
In this analysis, I’ve examined the Ethereum (ETH/USDT) 15M chart by inverting it.
It’s 12 March 2025, exactly 5 years since 12 March 2020, when Bitcoin crashed 55% in a single day, marking the “Black Thursday” that shook the market.
Now, the ETH chart shows the purple trendline as resistance (inverted to 1,684 USD) and green zones as support (inverted to 1,500-1,600 USD).
The pattern suggests a potential downturn; a break below the blue line could trigger a sharp pullback. Volume has risen by ~20% in the last hour, supporting this move.
Potential Scenario:
If resistance at 1,684 holds, the price may test support at 1,500-1,600, with a possible drop to 1,400. While not as severe as the 12 March 2020 crash, this week calls for caution. As a spot trader, I’m planning positions around the 1,600-1,500 range.
What do you think? Will ETH drop, or will the bull run continue? Share your thoughts below! 📉📈
Order cancelled
Disclaimer
The information and publications are not meant to be, and do not constitute, financial, investment, trading, or other types of advice or recommendations supplied or endorsed by TradingView. Read more in the Terms of Use.
Disclaimer
The information and publications are not meant to be, and do not constitute, financial, investment, trading, or other types of advice or recommendations supplied or endorsed by TradingView. Read more in the Terms of Use.