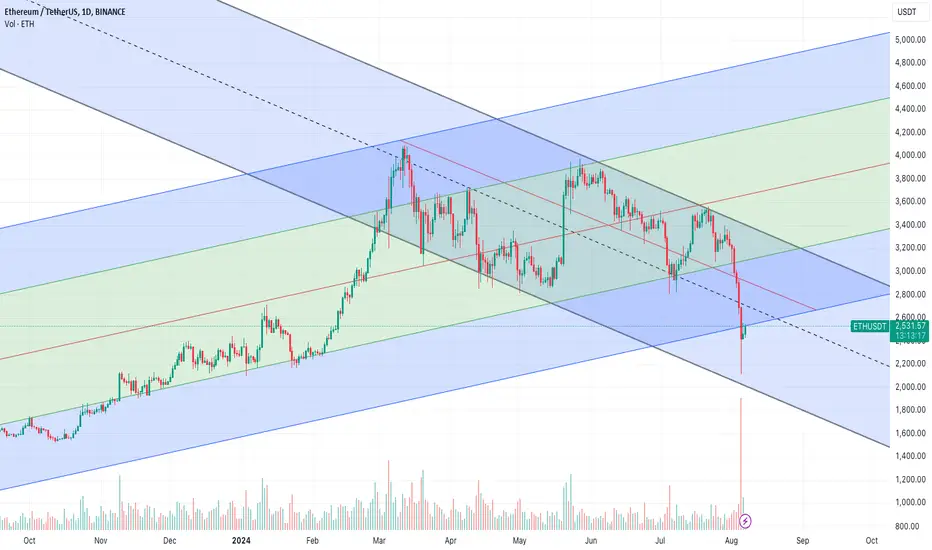
The recent candlestick with the large volume is a long red candle followed by a smaller green candle, which is a sign of potential short-term bottoming. However, this needs to be confirmed by further price action in the coming days.
The chart shows a significant spike in volume on the recent large red candle, which indicates a strong selling pressure. This suggests a potential capitulation or panic sell, followed by a slight recovery.
Decision Making:
For Holders: Given the higher probability of an upward movement, holding ETH might be a favorable decision, but the presence of a significant downward risk suggests that setting stop-loss orders or partial profit-taking strategies could help manage risk.
For Potential Buyers: The data suggests a favorable probability for entering a position, especially if you are prepared to handle potential short-term volatility.
Disclaimer
The information and publications are not meant to be, and do not constitute, financial, investment, trading, or other types of advice or recommendations supplied or endorsed by TradingView. Read more in the Terms of Use.
Disclaimer
The information and publications are not meant to be, and do not constitute, financial, investment, trading, or other types of advice or recommendations supplied or endorsed by TradingView. Read more in the Terms of Use.