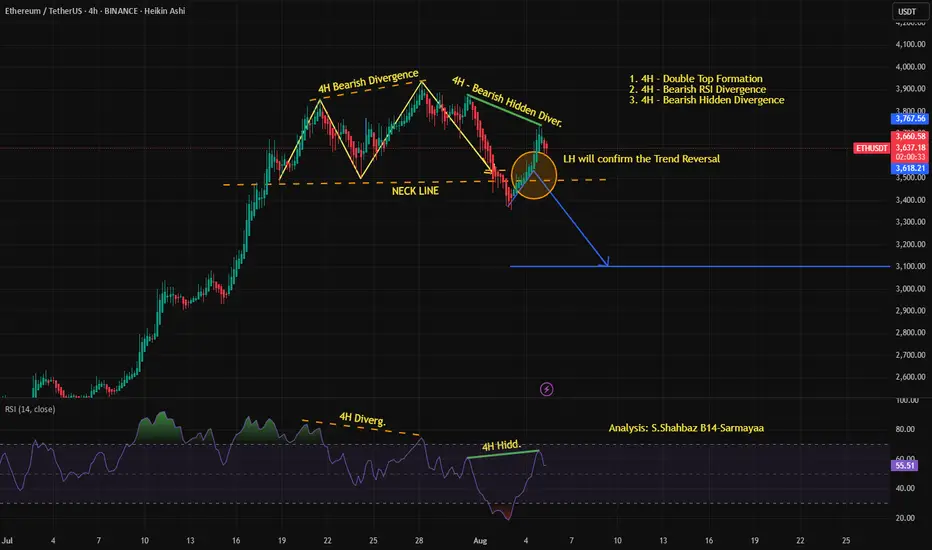
This 4H chart of Ethereum (ETH/USDT) is indicating a strong bearish reversal setup. A double top formation has formed near the $3,770 zone, accompanied by both a regular bearish divergence and a bearish hidden divergence on the RSI.
Price has broken down below the neckline of the double top, and a possible retest zone is marked, which may act as resistance.
If the price gets rejected from this retest area, the 4H confirmation candle will validate a trend reversal, potentially targeting the $3,100–3,000 zone.
Price has broken down below the neckline of the double top, and a possible retest zone is marked, which may act as resistance.
If the price gets rejected from this retest area, the 4H confirmation candle will validate a trend reversal, potentially targeting the $3,100–3,000 zone.
Trade active
Volume Footprints and Negative Delta on 1D & 4H confirm seller dominance, reinforcing the bearish reversal setup.Disclaimer
The information and publications are not meant to be, and do not constitute, financial, investment, trading, or other types of advice or recommendations supplied or endorsed by TradingView. Read more in the Terms of Use.
Disclaimer
The information and publications are not meant to be, and do not constitute, financial, investment, trading, or other types of advice or recommendations supplied or endorsed by TradingView. Read more in the Terms of Use.