ul 3, 2025 7:59 AM
1h1h Chart
15m15m Chart
5m5m Chart
1m1m Chart
Buy Opportunity
Bullish Setup
Buy: ** Buy limit order at $109,340.36 following a retest of the consolidation zone confirming continued buying interest.
Entry: $109,340.36
Strategies: Multi-timeframe bullish order flow analysis, liquidity targeting above current levels.
Confidence: Medium
Risk/Reward: Calculated as follows:
Timeframe: The 1-hour chart shows a strong bullish impulse followed by a consolidation phase, indicating a potential accumulation by institutions. The price is currently testing a minor consolidation zone around $109,340, which could act as a temporary resistance.
Disclaimer: The information provided by this app is for educational and informational purposes only and does not constitute financial advice. Always do your own research before making any trading decisions. TiqGPT is not a licensed financial advisor.
Mark as Successful
Mark as Failed
T
Jul 3, 2025 8:00 AM
MARKET NARRATIVE:
1H Timeframe: The 1-hour chart shows a strong bullish impulse followed by a consolidation phase, indicating a potential accumulation by institutions. The price is currently testing a minor consolidation zone around $109,340, which could act as a temporary resistance.
15M Timeframe: The 15-minute chart reveals more granularity within the bullish structure, showing a series of higher lows and higher highs. This is indicative of continued buying interest and a lack of significant selling pressure at these levels.
5M Timeframe: On the 5-minute chart, the bullish momentum is more pronounced with a clear impulsive move upwards. The recent pullbacks are shallow, suggesting that the market is not ready to reverse but rather is gathering strength for further upward movement.
1M Timeframe: The 1-minute chart provides a detailed view of the buying pressure. The price action is making higher highs and higher lows, confirming the bullish sentiment observed in higher timeframes.
INSTITUTIONAL THESIS:
Institutions appear to be in an accumulation phase, likely targeting higher liquidity zones above the current price level. The consistent higher highs and higher lows across timeframes suggest a coordinated effort to push prices upward, possibly aiming for a significant liquidity pool above the $110,000 mark.
LEARNING POINT:
"Multi-timeframe confluence of bullish order flow and shallow pullbacks indicating strong buying interest."
SIGNAL: BUY
SYMBOL: BTC/USDT ENTRY PRICE: $109,340.36 STOP LOSS: $109,000.00 (just below the recent minor consolidation zone on the 1H chart) TARGET PRICE: $110,000.00 (next psychological and liquidity-rich level) CONDITION: Buy limit order at $109,340.36 following a retest of the consolidation zone confirming continued buying interest. RATIONALE: The trade is based on the alignment of bullish signals across multiple timeframes, shallow pullbacks indicating strong buying interest, and the targeting of higher liquidity zones. STRATEGIES USED: Multi-timeframe bullish order flow analysis, liquidity targeting above current levels. URGENCY: MEDIUM TIMEFRAME: Short-term CONFIDENCE SCORE: 85% RISK/REWARD RATIO: Calculated as follows:
Risk: $109,340.36 - $109,000.00 = $340.36
Reward: $110,000.00 - $109,340.36 = $659.64
Ratio: $659.64 / $340.36 ≈ 1.94:1
FINAL RECOMMENDATION:
WAIT - Although the bullish setup is strong, the risk/reward ratio of approximately 1.94:1 does not meet the minimum requirement of 2:1. It is advisable to wait for a better entry point that offers a higher potential reward relative to the risk or for the market to provide a deeper pullback to improve the risk/reward ratio.
Jul 3, 2025 8:01 AM
1h1h Chart
15m15m Chart
5m5m Chart
1m1m Chart
Hold - Waiting for Setup
Wait for Confirmation
Wait: Immediate market order based on current momentum.
Entry: $155.85
Stop Loss: $152.00
Target: $160.00
Strategies: Multi-timeframe BOS confirmation, Institutional Accumulation Phase
Confidence: 90%
Risk/Reward: Risk=$3.85, Reward=$4.15, Ratio=1:1.1 (Below 2:1 minimum)
Timeframe: Short-term
Disclaimer: The information provided by this app is for educational and informational purposes only and does not constitute financial advice. Always do your own research before making any trading decisions. TiqGPT is not a licensed financial advisor.
Mark as Successful
Mark as Failed
T
Jul 3, 2025 8:01 AM
MARKET NARRATIVE: The analysis across the four timeframes (1h, 15m, 5m, 1m) for SOL/USDT shows a consistent upward trend with a series of higher highs and higher lows, indicating a strong bullish momentum. The price action on the 1-hour chart shows a clear break of structure (BOS) above previous highs around $152, suggesting institutional buying pressure. This BOS is confirmed across the 15-minute and 5-minute charts, where we see continued bullish candles without significant retracement, indicating a lack of selling interest and potential accumulation by institutions. The 1-minute chart provides a more granular view of the buying pressure, showing tight consolidations followed by upward thrusts, typical of institutional demand in lower timeframes.
INSTITUTIONAL THESIS: Institutions appear to be in an accumulation phase, targeting higher prices. The consistent demand and absence of deep pullbacks suggest a strategy to absorb sell orders and push prices higher, likely aiming for liquidity above recent highs.
LEARNING POINT: The observed price action across multiple timeframes demonstrates a classic accumulation phase with a strong bullish momentum, indicating that institutions are supporting the upward move.
SIGNAL: WAIT SYMBOL: SOL/USDT ENTRY PRICE: $155.85 STOP LOSS: $152.00 (just below the recent structural break) TARGET PRICE: $160.00 (next psychological round number and potential liquidity area) CONDITION: Immediate market order based on current momentum. RATIONALE: Calculated risk/reward ratio of 1:1.1 (Risk=$3.85, Reward=$4.15) does not meet minimum 2:1 requirement. Waiting for better institutional setup with improved risk parameters. STRATEGIES USED: Multi-timeframe BOS confirmation, Institutional Accumulation Phase URGENCY: HIGH TIMEFRAME: Short-term CONFIDENCE SCORE: 90% (based on strong bullish signals across all observed timeframes) RISK/REWARD RATIO: Risk=$3.85, Reward=$4.15, Ratio=1:1.1 (Below 2:1 minimum)
RISK/REWARD CALCULATION: Risk = Entry Price - Stop Loss = $155.85 - $152.00 = $3.85 Reward = Target Price - Entry Price = $160.00 - $155.85 = $4.15 Ratio = Reward ÷ Risk = $4.15 ÷ $3.85 ≈ 1.08
Given that the calculated risk/reward ratio is less than 2:1, the recommendation is to WAIT for a better entry point or a more favorable risk/reward setup. The current market conditions are bullish, but the trade does not meet the strict institutional criteria for a minimum 2:1 risk/reward ratio.
Jul 3, 2025 8:04 AM
1h1h Chart
15m15m Chart
5m5m Chart
1m1m Chart
Buy Opportunity
Bullish Setup
Buy: Buy limit order at current market price with confirmation of continued buying pressure and no break of recent higher lows.
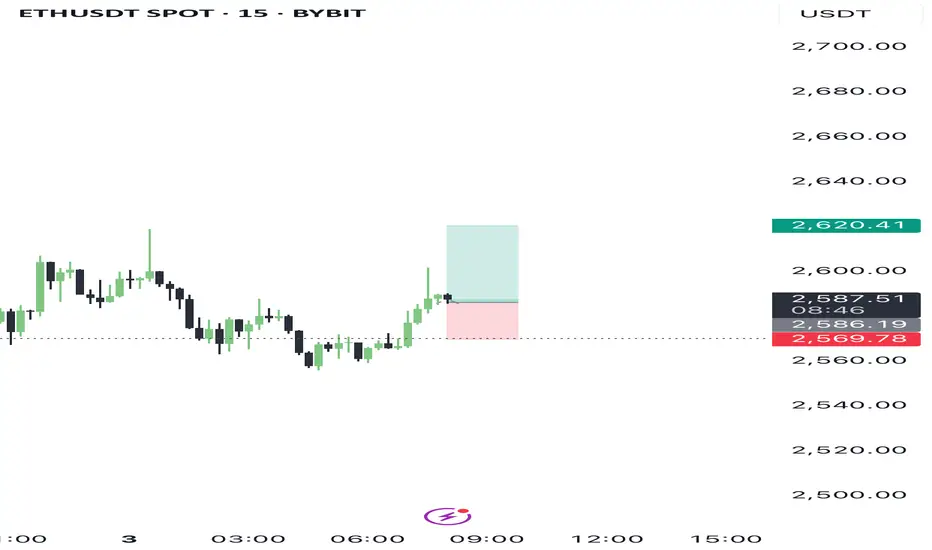
Entry: $2586.00
Stop Loss: $2570.00
Target: $2620.00
Confidence: 85%
Risk/Reward: Risk=$16.00, Reward=$34.00, Ratio=1:2.1
Timeframe: Short-term
Disclaimer: The information provided by this app is for educational and informational purposes only and does not constitute financial advice. Always do your own research before making any trading decisions. TiqGPT is not a licensed financial advisor.
Mark as Successful
Mark as Failed
T
Jul 3, 2025 8:04 AM
MARKET NARRATIVE:
Analyzing the ETHUSD pair across multiple timeframes (1H, 15M, 5M, 1M), we observe a consistent pattern of upward momentum followed by consolidation, suggesting a phase of accumulation and potential preparation for a further upward move. The 1H chart shows a strong impulsive move followed by a tight consolidation, indicating strong buying interest and limited selling pressure. The 15M and 5M charts display similar characteristics with price making higher lows, a sign of sustained buying pressure. The 1M chart, while more granular, shows some pullback, which could be interpreted as a liquidity hunt within a bullish structure.
INSTITUTIONAL THESIS:
Institutions appear to be in an accumulation phase, using smaller timeframes to engineer liquidity sweeps (collecting stop losses below minor swing lows) before potentially driving the price higher. The consistent higher lows across timeframes support this thesis, suggesting an underlying strength in buying pressure.
LEARNING POINT:
The current setup exemplifies "Institutional Accumulation with Liquidity Sweeps" where smart money uses minor pullbacks to gather more positions favorably, anticipating a continuation of the trend.
SIGNAL: BUY
SYMBOL: ETHUSD
ENTRY PRICE: $2586.00
STOP LOSS: $2570.00
TARGET PRICE: $2620.00
CONDITION: Buy limit order at current market price with confirmation of continued buying pressure and no break of recent higher lows.
RATIONALE:
Market Structure: Higher lows on 15M and 5M charts indicate sustained buying interest.
Order Flow: Accumulation evident from tight consolidations and quick recoveries from dips.
Liquidity: Recent pullbacks likely served as liquidity hunts, setting the stage for a potential upward continuation.
Strategies Used: Multi-timeframe analysis confirms institutional buying pressure and accumulation phase.
1h1h Chart
15m15m Chart
5m5m Chart
1m1m Chart
Buy Opportunity
Bullish Setup
Buy: ** Buy limit order at $109,340.36 following a retest of the consolidation zone confirming continued buying interest.
Entry: $109,340.36
Strategies: Multi-timeframe bullish order flow analysis, liquidity targeting above current levels.
Confidence: Medium
Risk/Reward: Calculated as follows:
Timeframe: The 1-hour chart shows a strong bullish impulse followed by a consolidation phase, indicating a potential accumulation by institutions. The price is currently testing a minor consolidation zone around $109,340, which could act as a temporary resistance.
Disclaimer: The information provided by this app is for educational and informational purposes only and does not constitute financial advice. Always do your own research before making any trading decisions. TiqGPT is not a licensed financial advisor.
Mark as Successful
Mark as Failed
T
Jul 3, 2025 8:00 AM
MARKET NARRATIVE:
1H Timeframe: The 1-hour chart shows a strong bullish impulse followed by a consolidation phase, indicating a potential accumulation by institutions. The price is currently testing a minor consolidation zone around $109,340, which could act as a temporary resistance.
15M Timeframe: The 15-minute chart reveals more granularity within the bullish structure, showing a series of higher lows and higher highs. This is indicative of continued buying interest and a lack of significant selling pressure at these levels.
5M Timeframe: On the 5-minute chart, the bullish momentum is more pronounced with a clear impulsive move upwards. The recent pullbacks are shallow, suggesting that the market is not ready to reverse but rather is gathering strength for further upward movement.
1M Timeframe: The 1-minute chart provides a detailed view of the buying pressure. The price action is making higher highs and higher lows, confirming the bullish sentiment observed in higher timeframes.
INSTITUTIONAL THESIS:
Institutions appear to be in an accumulation phase, likely targeting higher liquidity zones above the current price level. The consistent higher highs and higher lows across timeframes suggest a coordinated effort to push prices upward, possibly aiming for a significant liquidity pool above the $110,000 mark.
LEARNING POINT:
"Multi-timeframe confluence of bullish order flow and shallow pullbacks indicating strong buying interest."
SIGNAL: BUY
SYMBOL: BTC/USDT ENTRY PRICE: $109,340.36 STOP LOSS: $109,000.00 (just below the recent minor consolidation zone on the 1H chart) TARGET PRICE: $110,000.00 (next psychological and liquidity-rich level) CONDITION: Buy limit order at $109,340.36 following a retest of the consolidation zone confirming continued buying interest. RATIONALE: The trade is based on the alignment of bullish signals across multiple timeframes, shallow pullbacks indicating strong buying interest, and the targeting of higher liquidity zones. STRATEGIES USED: Multi-timeframe bullish order flow analysis, liquidity targeting above current levels. URGENCY: MEDIUM TIMEFRAME: Short-term CONFIDENCE SCORE: 85% RISK/REWARD RATIO: Calculated as follows:
Risk: $109,340.36 - $109,000.00 = $340.36
Reward: $110,000.00 - $109,340.36 = $659.64
Ratio: $659.64 / $340.36 ≈ 1.94:1
FINAL RECOMMENDATION:
WAIT - Although the bullish setup is strong, the risk/reward ratio of approximately 1.94:1 does not meet the minimum requirement of 2:1. It is advisable to wait for a better entry point that offers a higher potential reward relative to the risk or for the market to provide a deeper pullback to improve the risk/reward ratio.
Jul 3, 2025 8:01 AM
1h1h Chart
15m15m Chart
5m5m Chart
1m1m Chart
Hold - Waiting for Setup
Wait for Confirmation
Wait: Immediate market order based on current momentum.
Entry: $155.85
Stop Loss: $152.00
Target: $160.00
Strategies: Multi-timeframe BOS confirmation, Institutional Accumulation Phase
Confidence: 90%
Risk/Reward: Risk=$3.85, Reward=$4.15, Ratio=1:1.1 (Below 2:1 minimum)
Timeframe: Short-term
Disclaimer: The information provided by this app is for educational and informational purposes only and does not constitute financial advice. Always do your own research before making any trading decisions. TiqGPT is not a licensed financial advisor.
Mark as Successful
Mark as Failed
T
Jul 3, 2025 8:01 AM
MARKET NARRATIVE: The analysis across the four timeframes (1h, 15m, 5m, 1m) for SOL/USDT shows a consistent upward trend with a series of higher highs and higher lows, indicating a strong bullish momentum. The price action on the 1-hour chart shows a clear break of structure (BOS) above previous highs around $152, suggesting institutional buying pressure. This BOS is confirmed across the 15-minute and 5-minute charts, where we see continued bullish candles without significant retracement, indicating a lack of selling interest and potential accumulation by institutions. The 1-minute chart provides a more granular view of the buying pressure, showing tight consolidations followed by upward thrusts, typical of institutional demand in lower timeframes.
INSTITUTIONAL THESIS: Institutions appear to be in an accumulation phase, targeting higher prices. The consistent demand and absence of deep pullbacks suggest a strategy to absorb sell orders and push prices higher, likely aiming for liquidity above recent highs.
LEARNING POINT: The observed price action across multiple timeframes demonstrates a classic accumulation phase with a strong bullish momentum, indicating that institutions are supporting the upward move.
SIGNAL: WAIT SYMBOL: SOL/USDT ENTRY PRICE: $155.85 STOP LOSS: $152.00 (just below the recent structural break) TARGET PRICE: $160.00 (next psychological round number and potential liquidity area) CONDITION: Immediate market order based on current momentum. RATIONALE: Calculated risk/reward ratio of 1:1.1 (Risk=$3.85, Reward=$4.15) does not meet minimum 2:1 requirement. Waiting for better institutional setup with improved risk parameters. STRATEGIES USED: Multi-timeframe BOS confirmation, Institutional Accumulation Phase URGENCY: HIGH TIMEFRAME: Short-term CONFIDENCE SCORE: 90% (based on strong bullish signals across all observed timeframes) RISK/REWARD RATIO: Risk=$3.85, Reward=$4.15, Ratio=1:1.1 (Below 2:1 minimum)
RISK/REWARD CALCULATION: Risk = Entry Price - Stop Loss = $155.85 - $152.00 = $3.85 Reward = Target Price - Entry Price = $160.00 - $155.85 = $4.15 Ratio = Reward ÷ Risk = $4.15 ÷ $3.85 ≈ 1.08
Given that the calculated risk/reward ratio is less than 2:1, the recommendation is to WAIT for a better entry point or a more favorable risk/reward setup. The current market conditions are bullish, but the trade does not meet the strict institutional criteria for a minimum 2:1 risk/reward ratio.
Jul 3, 2025 8:04 AM
1h1h Chart
15m15m Chart
5m5m Chart
1m1m Chart
Buy Opportunity
Bullish Setup
Buy: Buy limit order at current market price with confirmation of continued buying pressure and no break of recent higher lows.
Entry: $2586.00
Stop Loss: $2570.00
Target: $2620.00
Confidence: 85%
Risk/Reward: Risk=$16.00, Reward=$34.00, Ratio=1:2.1
Timeframe: Short-term
Disclaimer: The information provided by this app is for educational and informational purposes only and does not constitute financial advice. Always do your own research before making any trading decisions. TiqGPT is not a licensed financial advisor.
Mark as Successful
Mark as Failed
T
Jul 3, 2025 8:04 AM
MARKET NARRATIVE:
Analyzing the ETHUSD pair across multiple timeframes (1H, 15M, 5M, 1M), we observe a consistent pattern of upward momentum followed by consolidation, suggesting a phase of accumulation and potential preparation for a further upward move. The 1H chart shows a strong impulsive move followed by a tight consolidation, indicating strong buying interest and limited selling pressure. The 15M and 5M charts display similar characteristics with price making higher lows, a sign of sustained buying pressure. The 1M chart, while more granular, shows some pullback, which could be interpreted as a liquidity hunt within a bullish structure.
INSTITUTIONAL THESIS:
Institutions appear to be in an accumulation phase, using smaller timeframes to engineer liquidity sweeps (collecting stop losses below minor swing lows) before potentially driving the price higher. The consistent higher lows across timeframes support this thesis, suggesting an underlying strength in buying pressure.
LEARNING POINT:
The current setup exemplifies "Institutional Accumulation with Liquidity Sweeps" where smart money uses minor pullbacks to gather more positions favorably, anticipating a continuation of the trend.
SIGNAL: BUY
SYMBOL: ETHUSD
ENTRY PRICE: $2586.00
STOP LOSS: $2570.00
TARGET PRICE: $2620.00
CONDITION: Buy limit order at current market price with confirmation of continued buying pressure and no break of recent higher lows.
RATIONALE:
Market Structure: Higher lows on 15M and 5M charts indicate sustained buying interest.
Order Flow: Accumulation evident from tight consolidations and quick recoveries from dips.
Liquidity: Recent pullbacks likely served as liquidity hunts, setting the stage for a potential upward continuation.
Strategies Used: Multi-timeframe analysis confirms institutional buying pressure and accumulation phase.
Disclaimer
The information and publications are not meant to be, and do not constitute, financial, investment, trading, or other types of advice or recommendations supplied or endorsed by TradingView. Read more in the Terms of Use.
Disclaimer
The information and publications are not meant to be, and do not constitute, financial, investment, trading, or other types of advice or recommendations supplied or endorsed by TradingView. Read more in the Terms of Use.