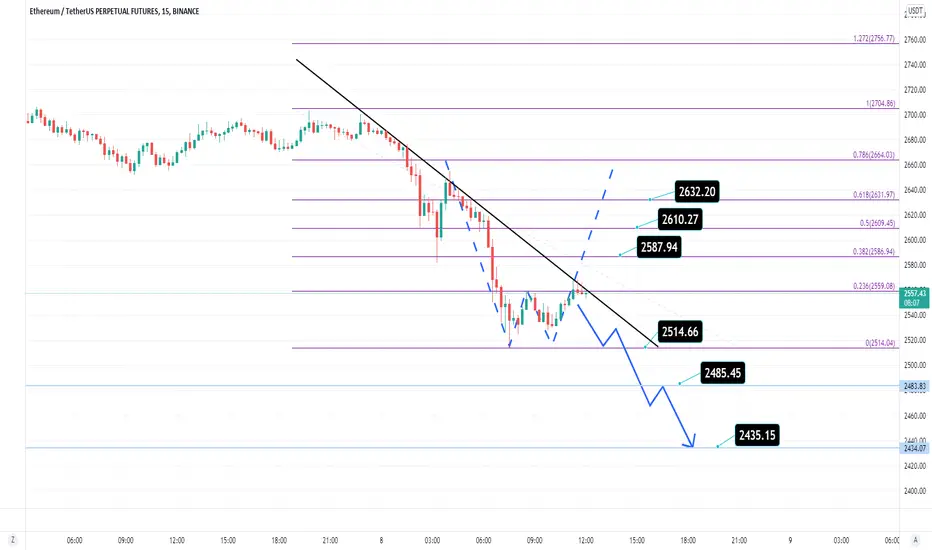
In this time frame, the price is in a downtrend,
and given that we see the Double Bottom Pattern if it can cross up the trend line,
we expect the price to climb towards the 0.5 and 0.618 Fibonacci ranges.
If the trend line creates resistance,
we will see a continuation of the downtress to the support range of 2435.
Support Range: 2514 - 2485 - 2435
Resistance range: 2587- 2610 - 2632
GOODLUCK
SANAM
Disclaimer
The information and publications are not meant to be, and do not constitute, financial, investment, trading, or other types of advice or recommendations supplied or endorsed by TradingView. Read more in the Terms of Use.
Disclaimer
The information and publications are not meant to be, and do not constitute, financial, investment, trading, or other types of advice or recommendations supplied or endorsed by TradingView. Read more in the Terms of Use.
