### *The Analysis of "EURJPY" $-hour time frame Chart:
#### *1. Tools Used:*
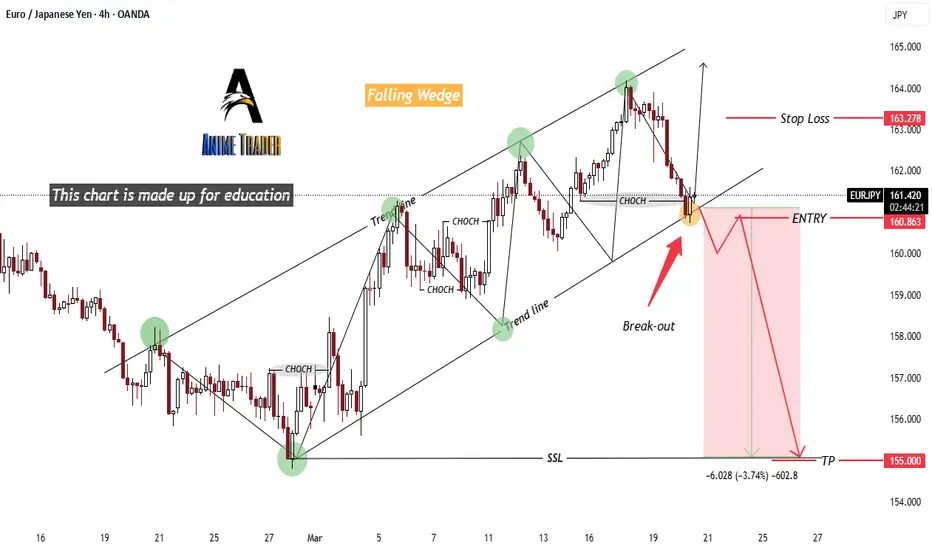
- *Trend Lines:*
- Two trend lines forming an *ascending channel* (uptrend structure).
- A breakout of the lower trend line suggests a potential bearish move.
- *Smart Money Concepts (SMC):*
- *CHOCH (Change of Character):* Indicates a shift in market direction.
- *SSL (Sell-Side Liquidity):* Suggests a liquidity grab before price moves lower.
- *Support & Resistance Levels:*
- *Stop Loss (SL)* is placed above the previous high.
- *Take Profit (TP)* is set at a significant support level near 155.000.
---
#### *2. Patterns Applied:*
- *Falling Wedge (Reversal Pattern):*
- The price has formed a rising channel that might break downwards.
- *Breakout & Retest:*
- Price has broken below the trendline and is expected to retest before continuing downward.
---
#### *3. Trade Setup & Expected Movement:*
- *Entry:* Below the trendline after the breakout.
- *Stop Loss (SL):* Above the last high (~163.278).
- *Take Profit (TP):* Near 155.000, targeting the next support level.
- *Risk/Reward Ratio:* The setup suggests a *bearish trade*, expecting a downward continuation.
### *Conclusion:*
- The chart suggests a *bearish setup* after breaking the ascending trendline.
- *If price re-enters the channel, the bearish trade could be invalidated.*
- The *Falling Wedge* pattern indicates a potential reversal, but confirmation is required.
Would you like a deeper breakdown of risk management for this trade?
#### *1. Tools Used:*
- *Trend Lines:*
- Two trend lines forming an *ascending channel* (uptrend structure).
- A breakout of the lower trend line suggests a potential bearish move.
- *Smart Money Concepts (SMC):*
- *CHOCH (Change of Character):* Indicates a shift in market direction.
- *SSL (Sell-Side Liquidity):* Suggests a liquidity grab before price moves lower.
- *Support & Resistance Levels:*
- *Stop Loss (SL)* is placed above the previous high.
- *Take Profit (TP)* is set at a significant support level near 155.000.
---
#### *2. Patterns Applied:*
- *Falling Wedge (Reversal Pattern):*
- The price has formed a rising channel that might break downwards.
- *Breakout & Retest:*
- Price has broken below the trendline and is expected to retest before continuing downward.
---
#### *3. Trade Setup & Expected Movement:*
- *Entry:* Below the trendline after the breakout.
- *Stop Loss (SL):* Above the last high (~163.278).
- *Take Profit (TP):* Near 155.000, targeting the next support level.
- *Risk/Reward Ratio:* The setup suggests a *bearish trade*, expecting a downward continuation.
### *Conclusion:*
- The chart suggests a *bearish setup* after breaking the ascending trendline.
- *If price re-enters the channel, the bearish trade could be invalidated.*
- The *Falling Wedge* pattern indicates a potential reversal, but confirmation is required.
Would you like a deeper breakdown of risk management for this trade?
t.me/Xauusdanalysischartexperts
I deliver high-quality of forex signals and expert premium analysis updates, backed by meticulous analysis tools. and a commitment to exceptional results.
t.me/Xauusdanalysischartexperts
I deliver high-quality of forex signals and expert premium analysis updates, backed by meticulous analysis tools. and a commitment to exceptional results.
t.me/Xauusdanalysischartexperts
Disclaimer
The information and publications are not meant to be, and do not constitute, financial, investment, trading, or other types of advice or recommendations supplied or endorsed by TradingView. Read more in the Terms of Use.
t.me/Xauusdanalysischartexperts
I deliver high-quality of forex signals and expert premium analysis updates, backed by meticulous analysis tools. and a commitment to exceptional results.
t.me/Xauusdanalysischartexperts
I deliver high-quality of forex signals and expert premium analysis updates, backed by meticulous analysis tools. and a commitment to exceptional results.
t.me/Xauusdanalysischartexperts
Disclaimer
The information and publications are not meant to be, and do not constitute, financial, investment, trading, or other types of advice or recommendations supplied or endorsed by TradingView. Read more in the Terms of Use.