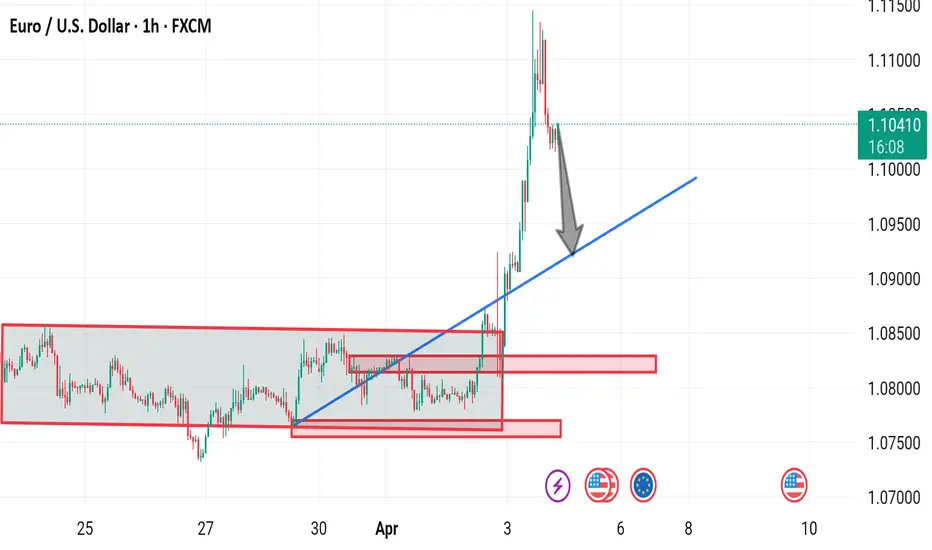
This is a forex trading chart for the EUR/USD currency pair on a 1-hour timeframe, published on TradingView. Key elements in the chart include:
1. Price Range (Red Box): A prolonged period of consolidation, where price remained within a horizontal range before breaking out.
2. Breakout and Uptrend (Blue Line): The price surged after breaking above the resistance zone.
3. Support and Retest (Red Zones): Previous resistance levels are now potential support zones.
4. Correction (Gray Arrow): The price might pull back towards the upward trendline or a support level before continuing its movement.
This chart suggests a technical analysis scenario where traders may look for a retest of the blue trendline before making further trading decisions. Let me know if you need further interpretation!
Trade closed: target reached
EURUSD Target successfully reached. Disclaimer
The information and publications are not meant to be, and do not constitute, financial, investment, trading, or other types of advice or recommendations supplied or endorsed by TradingView. Read more in the Terms of Use.
Disclaimer
The information and publications are not meant to be, and do not constitute, financial, investment, trading, or other types of advice or recommendations supplied or endorsed by TradingView. Read more in the Terms of Use.