Completed Elliott Wave Structure:
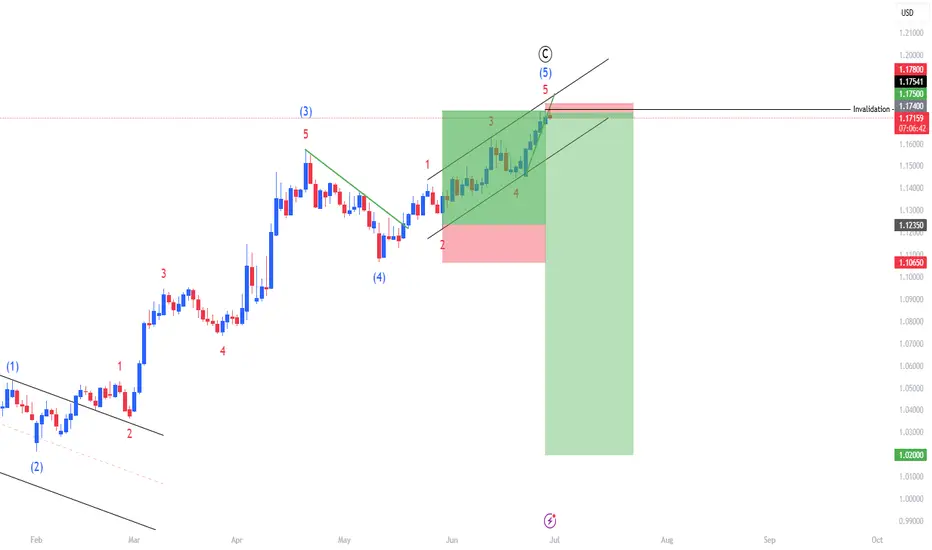
• The chart displays a full 5-wave impulsive Elliott Wave count to the upside, labeled (1) through (5), completing a wave C.
• This suggests the end of a corrective ABC pattern, which often marks the end of a bullish retracement or rally within a larger downtrend.
Price Reaches Resistance Zone:
• The price reaches a previous high/resistance area marked by the top of the wedge and completes the fifth wave.
• This is typically where institutional traders may look to take profits or enter short positions.
Risk-Reward Set Up Suggests Short Bias:
• The chart includes a bearish risk-reward trade setup, indicating the trader expects a decline.
• The stop loss is placed slightly above the peak of wave 5, and the take profit is much lower, giving a favorable risk-to-reward ratio in anticipation of a significant move down.
Structure Confluence:
• The top of wave (5) aligns with the trendline resistance from the rising wedge formation, adding technical confluence to the bearish outlook.
⸻
Conclusion
With a completed Elliott Wave count, bearish chart pattern (rising wedge), technical resistance, and a well-defined short setup, the chart strongly suggests that a major top may be in place for EUR/USD, and a downside move is likely to follow.
Disclaimer
The information and publications are not meant to be, and do not constitute, financial, investment, trading, or other types of advice or recommendations supplied or endorsed by TradingView. Read more in the Terms of Use.
Disclaimer
The information and publications are not meant to be, and do not constitute, financial, investment, trading, or other types of advice or recommendations supplied or endorsed by TradingView. Read more in the Terms of Use.