General Chart Details:
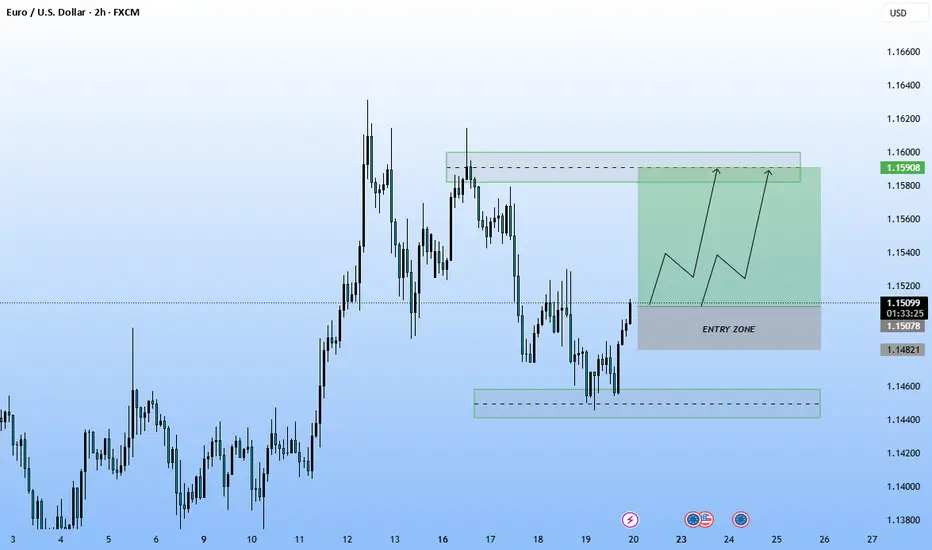
Pair: EUR/USD (Euro / U.S. Dollar)
Timeframe: 2-hour (2h)
Current Price: Around 1.15079
Exchange: FXCM
Date and Time: June 20, 2025, 23:24 UTC
Technical Analysis Elements:
Entry Zone:
Marked in a red-shaded box between roughly 1.1480 to 1.1510.
Suggests a buying area (long entry).
Target Zone:
A green-shaded box at the top between approximately 1.1580 and 1.1600.
Indicates a potential take-profit zone for the long trade.
Price Path Projection:
The green section has two arrow paths projecting a bullish movement from the entry zone toward the target zone.
Suggests expectation of a breakout and continuation pattern.
Support Zone:
A lower grey zone below 1.1460 indicates a stronger support or invalidation level if price breaks lower.
Interpretation:
This chart appears to outline a bullish setup:
The trader is anticipating price to bounce off the “Entry Zone” and head toward the resistance area (target zone).
The arrows show expected bullish price action through potential pullbacks and continuation toward 1.1580–1.1600.
Disclaimer
The information and publications are not meant to be, and do not constitute, financial, investment, trading, or other types of advice or recommendations supplied or endorsed by TradingView. Read more in the Terms of Use.
Disclaimer
The information and publications are not meant to be, and do not constitute, financial, investment, trading, or other types of advice or recommendations supplied or endorsed by TradingView. Read more in the Terms of Use.