🧠 EUR/USD – Rising Wedge Breakdown Signals Bearish Reversal
Pair: Euro / U.S. Dollar (EUR/USD)
Timeframe: 30-Minute (M30)
Strategy Type: Chart Pattern (Rising Wedge) → Bearish Reversal
Trend Bias: Short-term bearish after rising wedge breakdown
🔍 Pattern Explanation: Rising Wedge
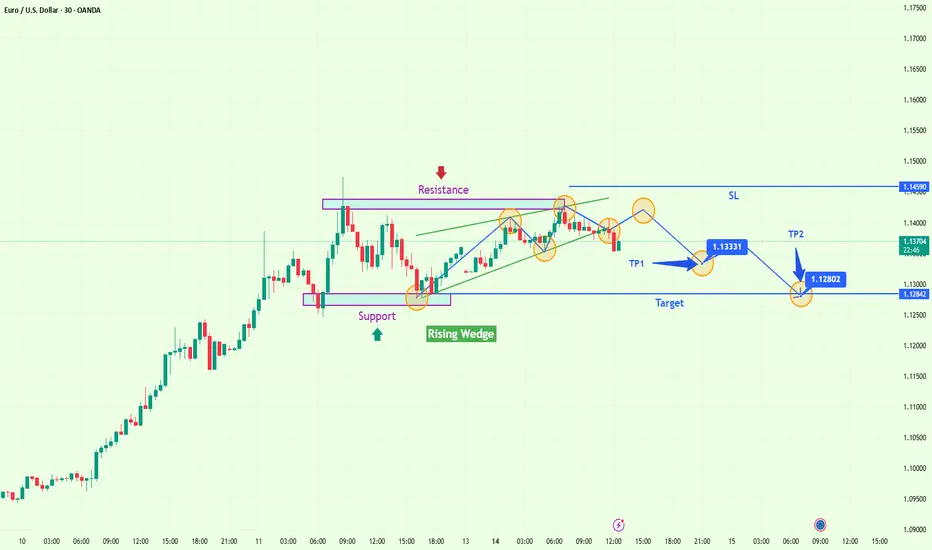
The chart presents a rising wedge pattern, one of the most reliable bearish reversal patterns in technical analysis. This pattern typically forms after an uptrend and represents a weakening bullish momentum. The wedge is characterized by two upward-sloping and converging trendlines—indicating buyers are losing strength even as the price makes new highs.
This usually precedes a breakdown to the downside, especially when the market hits a major resistance level, as seen in this setup.
📊 Chart Breakdown and Technical Justification
📈 Uptrend Origin:
The pair rallied from the support zone near 1.12842, showing aggressive bullish movement with strong momentum.
Buyers controlled the market up to the resistance around 1.14590, where price began consolidating within a wedge.
📐 Wedge Formation:
Price action became more narrow and volatile, forming higher highs and higher lows.
The bearish divergence in price action indicates fading momentum.
Volume decline during the wedge buildup is another classic sign that the move is losing power.
🚨 Breakdown Confirmation:
Price broke down below the lower wedge trendline, confirming the pattern.
A clean retest of the broken wedge support turned resistance at around 1.1400 validates the pattern.
This type of retest provides high-probability trade entries.
🧭 Trade Setup Details
Component Level Explanation
Entry 1.13900-1.14000 After wedge breakdown & bearish retest
Stop Loss (SL) 1.14590 Above key resistance – invalidation of breakdown
Take Profit 1 1.13331 First support zone / recent price memory
Take Profit 2 1.12802 Strong historical demand zone
🎯 Target Zone Explained:
TP1 (1.13331): Minor support from previous consolidation.
TP2 (1.12802): Major structure level that served as a demand base for the prior rally.
📌 Technical Indicators (Optional for Viewer Context):
RSI likely showing bearish divergence (not shown but inferred).
Volume drop during wedge buildup, spike on breakdown.
Clean price action forming lower highs post-breakout, suggesting bearish follow-through.
🧠 Market Psychology Behind the Move
Traders got trapped in the wedge, expecting continuation, but lack of momentum and proximity to resistance caused buyers to hesitate.
Sellers used this indecision to enter at premium prices, creating the breakdown.
Retest serves as a confirmation trigger for institutional traders and swing traders.
📉 Outlook & Risk Management
As long as price trades below the wedge and resistance zone, the bias remains bearish.
Stop loss above resistance ensures protection from false breakouts.
Risk-to-reward on this setup is more than 1:2, making it attractive for both intraday and swing traders.
🧾 Conclusion
This is a textbook rising wedge breakdown setup, offering a clear trade idea with strong confluence:
Major resistance level + pattern
Clear entry, SL, and targets
Excellent risk-to-reward profile
Breakdown confirmed with retest
This setup aligns with smart money behavior, where liquidity is gathered before a big directional move.
Pair: Euro / U.S. Dollar (EUR/USD)
Timeframe: 30-Minute (M30)
Strategy Type: Chart Pattern (Rising Wedge) → Bearish Reversal
Trend Bias: Short-term bearish after rising wedge breakdown
🔍 Pattern Explanation: Rising Wedge
The chart presents a rising wedge pattern, one of the most reliable bearish reversal patterns in technical analysis. This pattern typically forms after an uptrend and represents a weakening bullish momentum. The wedge is characterized by two upward-sloping and converging trendlines—indicating buyers are losing strength even as the price makes new highs.
This usually precedes a breakdown to the downside, especially when the market hits a major resistance level, as seen in this setup.
📊 Chart Breakdown and Technical Justification
📈 Uptrend Origin:
The pair rallied from the support zone near 1.12842, showing aggressive bullish movement with strong momentum.
Buyers controlled the market up to the resistance around 1.14590, where price began consolidating within a wedge.
📐 Wedge Formation:
Price action became more narrow and volatile, forming higher highs and higher lows.
The bearish divergence in price action indicates fading momentum.
Volume decline during the wedge buildup is another classic sign that the move is losing power.
🚨 Breakdown Confirmation:
Price broke down below the lower wedge trendline, confirming the pattern.
A clean retest of the broken wedge support turned resistance at around 1.1400 validates the pattern.
This type of retest provides high-probability trade entries.
🧭 Trade Setup Details
Component Level Explanation
Entry 1.13900-1.14000 After wedge breakdown & bearish retest
Stop Loss (SL) 1.14590 Above key resistance – invalidation of breakdown
Take Profit 1 1.13331 First support zone / recent price memory
Take Profit 2 1.12802 Strong historical demand zone
🎯 Target Zone Explained:
TP1 (1.13331): Minor support from previous consolidation.
TP2 (1.12802): Major structure level that served as a demand base for the prior rally.
📌 Technical Indicators (Optional for Viewer Context):
RSI likely showing bearish divergence (not shown but inferred).
Volume drop during wedge buildup, spike on breakdown.
Clean price action forming lower highs post-breakout, suggesting bearish follow-through.
🧠 Market Psychology Behind the Move
Traders got trapped in the wedge, expecting continuation, but lack of momentum and proximity to resistance caused buyers to hesitate.
Sellers used this indecision to enter at premium prices, creating the breakdown.
Retest serves as a confirmation trigger for institutional traders and swing traders.
📉 Outlook & Risk Management
As long as price trades below the wedge and resistance zone, the bias remains bearish.
Stop loss above resistance ensures protection from false breakouts.
Risk-to-reward on this setup is more than 1:2, making it attractive for both intraday and swing traders.
🧾 Conclusion
This is a textbook rising wedge breakdown setup, offering a clear trade idea with strong confluence:
Major resistance level + pattern
Clear entry, SL, and targets
Excellent risk-to-reward profile
Breakdown confirmed with retest
This setup aligns with smart money behavior, where liquidity is gathered before a big directional move.
Related publications
Disclaimer
The information and publications are not meant to be, and do not constitute, financial, investment, trading, or other types of advice or recommendations supplied or endorsed by TradingView. Read more in the Terms of Use.
Related publications
Disclaimer
The information and publications are not meant to be, and do not constitute, financial, investment, trading, or other types of advice or recommendations supplied or endorsed by TradingView. Read more in the Terms of Use.