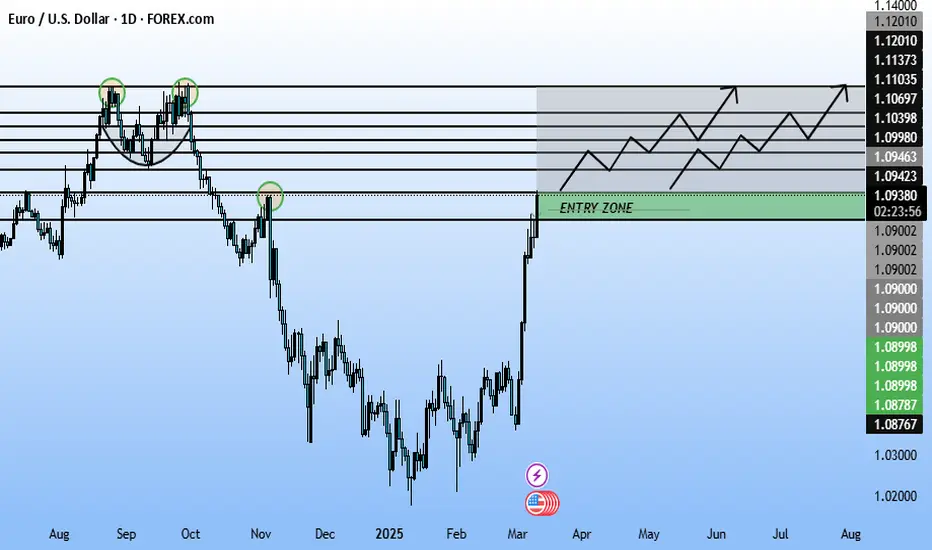
Euro / U.S. Dollar (EUR/USD) pair on a Daily (1D) timeframe.
Chart Details:
Exchange/Data Source: FOREX.com
Current Price: Around 1.09427
Recent Price Movement:
The chart shows a strong downward trend followed by a recovery.
Price has entered a potential entry zone, marked in green, suggesting a possible bullish reversal.
Key Levels:
Support Zone (Entry Zone): 1.08767 - 1.09427
Resistance Levels:
1.09986
1.10398
1.10697
1.11035
1.11373
1.12010 (Final Target)
Expected Price Action:
The chart suggests a bullish structure, with price expected to move upwards after testing the entry zone.
The zig-zag arrows indicate a potential higher-high and higher-low formation, leading to an upside breakout.
Trading Idea:
Potential Buy Entry: 1.08767 - 1.09427 (Entry Zone)
First Target: 1.09986
Second Target: 1.10697
Third Target: 1.11373
Final Target: 1.12010
Invalidation Level (Stop-Loss): Below 1.08767
This setup suggests a bullish continuation, but confirmation with additional indicators (like RSI, MACD) is recommended before entering a trade!
Trade active
Active Trade Let's put the enteries and make profit together,Disclaimer
The information and publications are not meant to be, and do not constitute, financial, investment, trading, or other types of advice or recommendations supplied or endorsed by TradingView. Read more in the Terms of Use.
Disclaimer
The information and publications are not meant to be, and do not constitute, financial, investment, trading, or other types of advice or recommendations supplied or endorsed by TradingView. Read more in the Terms of Use.