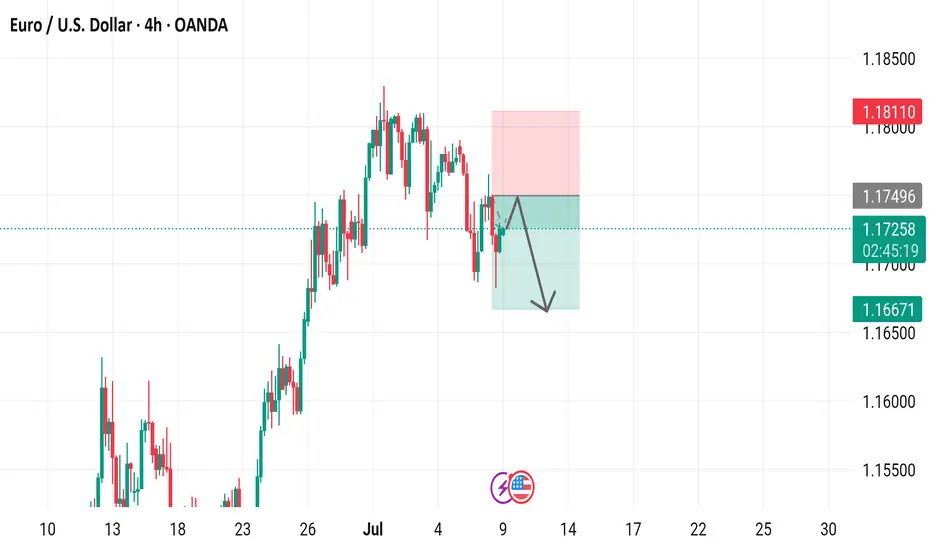
4-hour candlestick chart for the Euro/U.S. Dollar (EUR/USD) currency pair on the OANDA platform. The chart shows a recent upward trend followed by a consolidation phase, with key technical levels and trading signals indicated. The presence of "SELL" and "BUY" signals suggests active trading opportunities. The downward arrow within the shaded area hints at a potential bearish move. This chart is likely used by traders to analyze short-term price movements and make informed decisions.
Trade closed: target reached
Target achieved close full now enjoy guy's Daily XAU/USD FREE setups | Let's grow together!
| XAU/USD Trader | Telegram: https://t.me/Aleegoldsignals
| XAU/USD Trader | Telegram: https://t.me/Aleegoldsignals
Disclaimer
The information and publications are not meant to be, and do not constitute, financial, investment, trading, or other types of advice or recommendations supplied or endorsed by TradingView. Read more in the Terms of Use.
Daily XAU/USD FREE setups | Let's grow together!
| XAU/USD Trader | Telegram: https://t.me/Aleegoldsignals
| XAU/USD Trader | Telegram: https://t.me/Aleegoldsignals
Disclaimer
The information and publications are not meant to be, and do not constitute, financial, investment, trading, or other types of advice or recommendations supplied or endorsed by TradingView. Read more in the Terms of Use.