📊 EUR/USD 1H – Symmetrical Triangle Breakdown Signals Bearish Continuation | Multi-Target Short Setup
🧠 Technical Overview
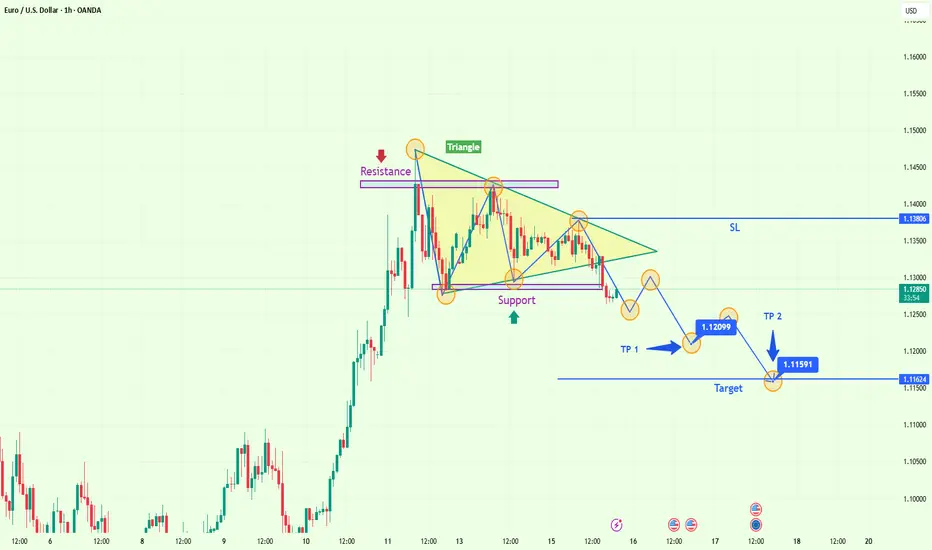
The EUR/USD pair, following a strong impulsive rally, entered a consolidation phase forming a symmetrical triangle pattern, a classic structure indicating potential breakout behavior. This technical formation is most reliable when it emerges after a strong trend — in this case, the bullish rally that occurred around April 10–11.
However, instead of continuation, the price action displayed signs of weakness at resistance and a failure to generate new highs, forming lower highs within the triangle. Eventually, the lower boundary was broken decisively, which marks the beginning of a bearish breakout and trend reversal opportunity.
🔺 Symmetrical Triangle Breakdown (Distribution Phase)
The symmetrical triangle is defined by:
Series of lower highs and higher lows, reflecting market indecision.
Tightening price action forming a triangular coil.
Bearish breakout confirms distribution and lack of bullish follow-through.
This triangle acted as a distribution zone, where large players offloaded long positions and began building shorts.
📌 Key Observation: The breakout occurred with a strong bearish candle, and the price is now retesting the previous support as new resistance (a classic breakdown confirmation setup).
📌 Important Technical Zones
🔴 Resistance (Supply Zone)
1.13400 – 1.13806
Price was rejected multiple times in this zone.
Aligned with the upper triangle boundary.
Becomes the invalidation level for any short position (Stop Loss placement).
🟣 Support (Demand Zone – Now Broken)
1.12500 – 1.12700
Served as the triangle’s lower boundary.
Recently broken → Now acting as potential resistance (role-reversal zone).
🔵 Stop Loss (SL) Level
Placed at 1.13806, above triangle resistance.
Above the recent highs to provide adequate breathing room while protecting capital.
🎯 Trade Execution Plan
✅ Entry Area
On breakdown and retest of triangle support (~1.12750–1.12850 zone)
Triggered after confirmation of bearish continuation (break and retest completed)
🎯 Target 1 (TP1)
1.12099
Measured move from triangle height.
Historically significant structure with multiple reactions.
🎯 Target 2 (TP2 / Final Take Profit)
1.11591 – 1.11624
Major support area (consolidation zone from early April)
Anticipated liquidity pool for institutional buyers.
🧠 Bearish Trade Rationale:
Symmetrical Triangle Breakdown
A key technical pattern known for momentum moves post-breakout.
Trend Exhaustion Signs
Momentum loss near resistance zone and failure to break higher indicates weakening bulls.
Bearish Market Structure Emergence
Formation of lower highs and lower lows after triangle breakout confirms reversal.
Volume and Volatility Support
Breakout candle accompanied by high volume and range, validating the move.
Fibonacci & Historical Confluence
Targets align with Fibonacci extensions and historical demand levels, strengthening the trade thesis.
⚠️ Risk Management Insight
Risk-to-Reward Ratio (RRR) ≈ 1:2.5 to TP2
Trade should be invalidated on strong close above 1.13806
Be mindful of upcoming high-impact economic events (FOMC, ECB, inflation data), which could affect volatility.
💡 Final Thoughts:
This is a textbook bearish triangle breakdown setup with solid confluence from technical, structural, and psychological perspectives. The entry offers a favorable RRR and a clean structure, making it suitable for both intraday and short-term swing traders. Monitoring price behavior around the TP1 zone is crucial, as partial profits may be booked, and SL can be moved to breakeven for a risk-free trade.
🧠 Technical Overview
The EUR/USD pair, following a strong impulsive rally, entered a consolidation phase forming a symmetrical triangle pattern, a classic structure indicating potential breakout behavior. This technical formation is most reliable when it emerges after a strong trend — in this case, the bullish rally that occurred around April 10–11.
However, instead of continuation, the price action displayed signs of weakness at resistance and a failure to generate new highs, forming lower highs within the triangle. Eventually, the lower boundary was broken decisively, which marks the beginning of a bearish breakout and trend reversal opportunity.
🔺 Symmetrical Triangle Breakdown (Distribution Phase)
The symmetrical triangle is defined by:
Series of lower highs and higher lows, reflecting market indecision.
Tightening price action forming a triangular coil.
Bearish breakout confirms distribution and lack of bullish follow-through.
This triangle acted as a distribution zone, where large players offloaded long positions and began building shorts.
📌 Key Observation: The breakout occurred with a strong bearish candle, and the price is now retesting the previous support as new resistance (a classic breakdown confirmation setup).
📌 Important Technical Zones
🔴 Resistance (Supply Zone)
1.13400 – 1.13806
Price was rejected multiple times in this zone.
Aligned with the upper triangle boundary.
Becomes the invalidation level for any short position (Stop Loss placement).
🟣 Support (Demand Zone – Now Broken)
1.12500 – 1.12700
Served as the triangle’s lower boundary.
Recently broken → Now acting as potential resistance (role-reversal zone).
🔵 Stop Loss (SL) Level
Placed at 1.13806, above triangle resistance.
Above the recent highs to provide adequate breathing room while protecting capital.
🎯 Trade Execution Plan
✅ Entry Area
On breakdown and retest of triangle support (~1.12750–1.12850 zone)
Triggered after confirmation of bearish continuation (break and retest completed)
🎯 Target 1 (TP1)
1.12099
Measured move from triangle height.
Historically significant structure with multiple reactions.
🎯 Target 2 (TP2 / Final Take Profit)
1.11591 – 1.11624
Major support area (consolidation zone from early April)
Anticipated liquidity pool for institutional buyers.
🧠 Bearish Trade Rationale:
Symmetrical Triangle Breakdown
A key technical pattern known for momentum moves post-breakout.
Trend Exhaustion Signs
Momentum loss near resistance zone and failure to break higher indicates weakening bulls.
Bearish Market Structure Emergence
Formation of lower highs and lower lows after triangle breakout confirms reversal.
Volume and Volatility Support
Breakout candle accompanied by high volume and range, validating the move.
Fibonacci & Historical Confluence
Targets align with Fibonacci extensions and historical demand levels, strengthening the trade thesis.
⚠️ Risk Management Insight
Risk-to-Reward Ratio (RRR) ≈ 1:2.5 to TP2
Trade should be invalidated on strong close above 1.13806
Be mindful of upcoming high-impact economic events (FOMC, ECB, inflation data), which could affect volatility.
💡 Final Thoughts:
This is a textbook bearish triangle breakdown setup with solid confluence from technical, structural, and psychological perspectives. The entry offers a favorable RRR and a clean structure, making it suitable for both intraday and short-term swing traders. Monitoring price behavior around the TP1 zone is crucial, as partial profits may be booked, and SL can be moved to breakeven for a risk-free trade.
Related publications
Disclaimer
The information and publications are not meant to be, and do not constitute, financial, investment, trading, or other types of advice or recommendations supplied or endorsed by TradingView. Read more in the Terms of Use.
Related publications
Disclaimer
The information and publications are not meant to be, and do not constitute, financial, investment, trading, or other types of advice or recommendations supplied or endorsed by TradingView. Read more in the Terms of Use.