📈 EURUSD at a Critical Decision Point Between Two Trends
EURUSD is coiling between descending resistance and ascending support. A breakout from either direction will likely define the next leg of the move. This post breaks down the converging structure, high-probability levels, and what traders should watch to stay on the right side of the market.
🔍 Technical Analysis:
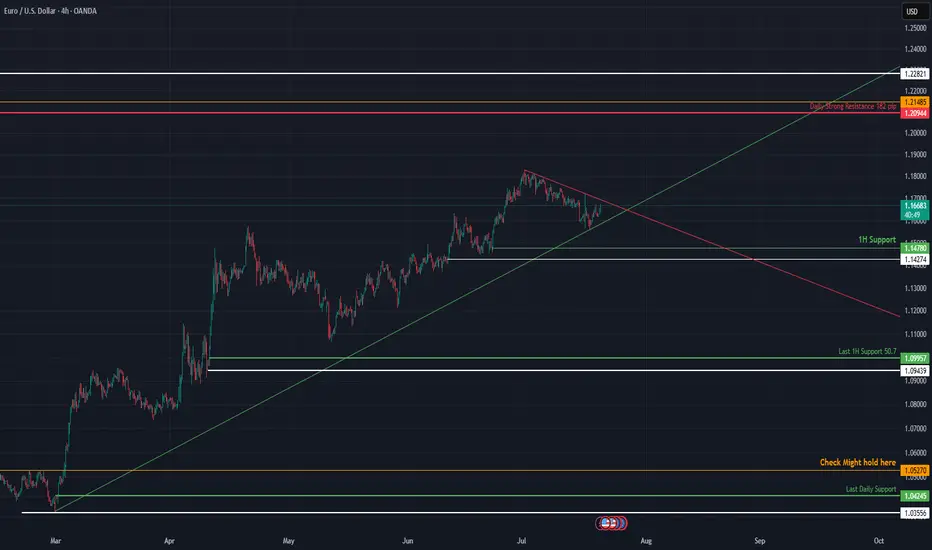
Price action is trapped between a downward sloping trendline (resistance) and a rising trendline (support), forming a symmetrical triangle. This compression indicates growing tension — and whichever trendline breaks first could dictate market direction in the coming weeks.
Currently, EURUSD is hovering near 1.1670, testing short-term structure while holding above prior swing supports.
🛡️ Support Zones (if downside breakout occurs):
🟢 1.1670 – 1H Support (High Risk)
First response zone on minor pullbacks.
Stop-loss: Below 1.1620
🟡 1.1470 – 1.1427 – Medium-Term Support (Medium Risk)
Confluence of diagonal and horizontal structure. Swing entry potential.
Stop-loss: Below 1.1380
🟠 1.0799 – Last 1H Support (Low Risk)
If the ascending trendline fails, this is the final zone to preserve a bullish structure.
Stop-loss: Below 1.0740
🔻 1.0242 – 1.0195 – Last Daily Support (Extreme Risk)
Loss of this zone marks a macro bearish shift.
🔼 Resistance Zones (if upside breakout occurs):
🔴 1.2094 – 1.2148: Daily Strong Resistance
Key breakout level. Strong historical supply. Clean close above here signals trend continuation.
Conclusion
EURUSD is at a technical fork — squeezed between opposing trendlines. The first decisive break will likely set the tone for Q3. Watch 1.2148 on the upside and 1.1427 on the downside for direction confirmation.
Not financial advice. Like & follow for more structured FX insights.
EURUSD is coiling between descending resistance and ascending support. A breakout from either direction will likely define the next leg of the move. This post breaks down the converging structure, high-probability levels, and what traders should watch to stay on the right side of the market.
🔍 Technical Analysis:
Price action is trapped between a downward sloping trendline (resistance) and a rising trendline (support), forming a symmetrical triangle. This compression indicates growing tension — and whichever trendline breaks first could dictate market direction in the coming weeks.
Currently, EURUSD is hovering near 1.1670, testing short-term structure while holding above prior swing supports.
🛡️ Support Zones (if downside breakout occurs):
🟢 1.1670 – 1H Support (High Risk)
First response zone on minor pullbacks.
Stop-loss: Below 1.1620
🟡 1.1470 – 1.1427 – Medium-Term Support (Medium Risk)
Confluence of diagonal and horizontal structure. Swing entry potential.
Stop-loss: Below 1.1380
🟠 1.0799 – Last 1H Support (Low Risk)
If the ascending trendline fails, this is the final zone to preserve a bullish structure.
Stop-loss: Below 1.0740
🔻 1.0242 – 1.0195 – Last Daily Support (Extreme Risk)
Loss of this zone marks a macro bearish shift.
🔼 Resistance Zones (if upside breakout occurs):
🔴 1.2094 – 1.2148: Daily Strong Resistance
Key breakout level. Strong historical supply. Clean close above here signals trend continuation.
Conclusion
EURUSD is at a technical fork — squeezed between opposing trendlines. The first decisive break will likely set the tone for Q3. Watch 1.2148 on the upside and 1.1427 on the downside for direction confirmation.
Not financial advice. Like & follow for more structured FX insights.
Disclaimer
The information and publications are not meant to be, and do not constitute, financial, investment, trading, or other types of advice or recommendations supplied or endorsed by TradingView. Read more in the Terms of Use.
Disclaimer
The information and publications are not meant to be, and do not constitute, financial, investment, trading, or other types of advice or recommendations supplied or endorsed by TradingView. Read more in the Terms of Use.