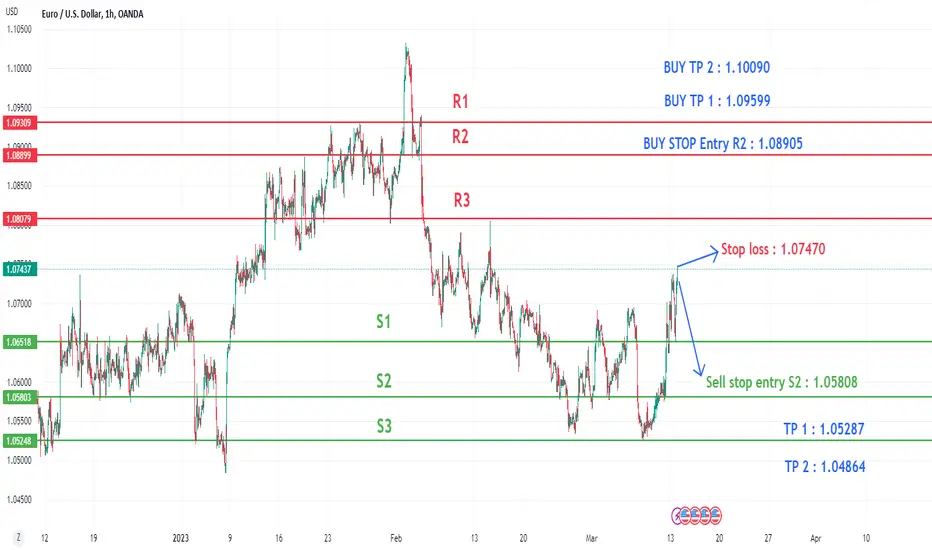
this chart support & resistance draw line is 4h time frame. and trade point is 1h time frame. when candles brake Support 1 it's a good sign for candles going on the downside and my order is active support 2. if the candlestick chart brakes the Resistance it's a vital sign of candles going on the Upside and my order is active Resistance line 2. and Take profit shown in the Chart. Follow these details.
Disclaimer
The information and publications are not meant to be, and do not constitute, financial, investment, trading, or other types of advice or recommendations supplied or endorsed by TradingView. Read more in the Terms of Use.
Disclaimer
The information and publications are not meant to be, and do not constitute, financial, investment, trading, or other types of advice or recommendations supplied or endorsed by TradingView. Read more in the Terms of Use.