📈 EUR/USD – Bullish Breakout from Falling Wedge: Momentum Shift in Progress
Timeframe: 1H (1-Hour Chart)
Currency Pair: EUR/USD
Date of Analysis: April 13, 2025
Market Type: Forex Spot
Pattern: Falling Wedge (Reversal)
Bias: Bullish
Trade Style: Swing/Position Entry
🧠 Technical Context & Pattern Recognition:
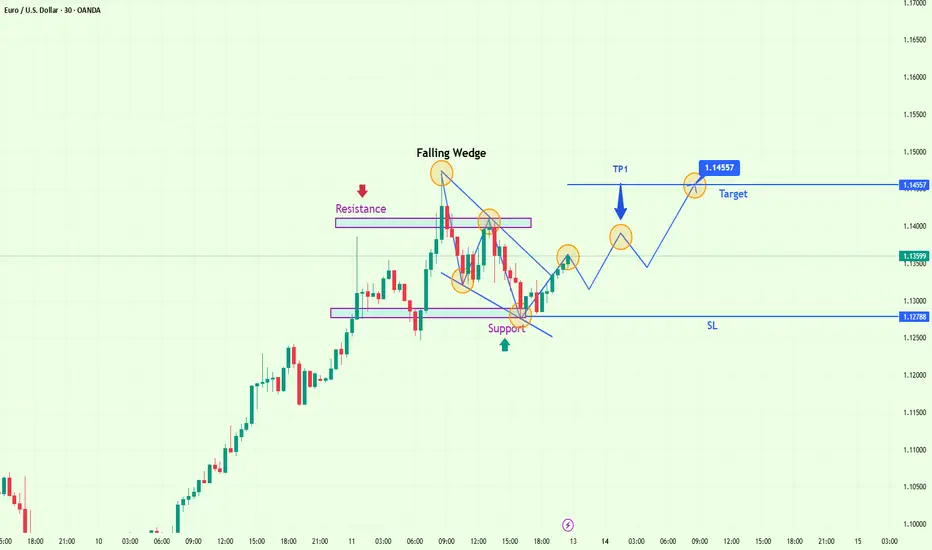
The EUR/USD has been under sustained bearish pressure, tracing a sequence of lower highs and lower lows from the recent high at ~1.0940. This selling pressure, however, began to weaken and consolidate into a Falling Wedge formation, typically recognized as a precursor to a bullish reversal.
This wedge has formed with converging downward-sloping trendlines, where the lower boundary shows diminishing momentum from sellers, while buyers begin stepping in at increasingly higher levels, creating a compression zone.
This is a textbook "coiling setup", often suggesting a market indecision that leads to a breakout once one side dominates — in this case, the bulls.
🔍 Detailed Structure Analysis:
✅ Upper Trendline (Resistance):
Connects the swing highs at ~1.0890, ~1.0860, and ~1.0835
Downward sloping, forming the top boundary of the wedge
✅ Lower Trendline (Support):
Connects the lower lows at ~1.0785, ~1.0775, and ~1.0760
Slightly steeper angle compared to the resistance line
✅ Apex & Compression:
The range tightens as price coils into the apex
This contraction hints at a volatility expansion phase to follow
✅ Volume Context (If Available):
Volume tends to decrease during wedge development
Breakout typically sees a spike in volume, confirming participation
🔔 Breakout Confirmation:
Price breaks and closes above the upper wedge trendline at ~1.0830
Bullish candle with strong body signals buy-side control
Retest of breakout area acts as new support, enhancing the setup's strength
🎯 Trade Setup & Scenario Planning:
Setup Element Details
Entry Zone 1.0830–1.0840 (post-breakout confirmation)
Stop Loss (SL) 1.0760 (below wedge support and swing low)
Take Profit 1 (TP1) 1.0995 – Near previous structural resistance
Take Profit 2 (TP2) 1.1455 – Projected target (measured move)
Risk-to-Reward Ratio Approx. 1:3+ (ideal for swing setups)
🧮 Measured Move Target Logic:
Wedge Height: ~160 pips (1.0940 – 1.0780)
Breakout Level: ~1.0830
Target Projection: 1.0830 + 160 = 1.0990–1.1000, with potential extension to 1.1455
🔑 Confluence & Supporting Evidence:
Bullish Divergence on RSI (lower lows in price, higher lows in RSI)
Breakout occurs at a key psychological zone near 1.0800
Support zone retest = high-confidence re-entry point
MACD crossover near the breakout zone (if applicable)
Candlestick structure signals momentum shift (bullish engulfing/breakout bar)
🧭 Trader’s Mindset & Risk Notes:
Use dynamic position sizing to manage risk (1–2% per trade)
Ideal conditions for scaling into the trade after retest confirmation
Be mindful of news events (ECB/US data) that could cause volatility
Avoid chasing after the move if missed; wait for pullbacks or re-tests
📘 Conclusion:
This Falling Wedge breakout on EUR/USD is a classic example of a reversal structure unfolding after trend exhaustion. Price action confirms the shift in momentum through a strong bullish breakout, offering traders a clean technical setup with favorable risk-reward.
With confluence from RSI divergence, structure breakout, and clean trendline compression, this chart supports a bullish continuation narrative with near-term targets around 1.0995 and long-term potential towards 1.1455.
Timeframe: 1H (1-Hour Chart)
Currency Pair: EUR/USD
Date of Analysis: April 13, 2025
Market Type: Forex Spot
Pattern: Falling Wedge (Reversal)
Bias: Bullish
Trade Style: Swing/Position Entry
🧠 Technical Context & Pattern Recognition:
The EUR/USD has been under sustained bearish pressure, tracing a sequence of lower highs and lower lows from the recent high at ~1.0940. This selling pressure, however, began to weaken and consolidate into a Falling Wedge formation, typically recognized as a precursor to a bullish reversal.
This wedge has formed with converging downward-sloping trendlines, where the lower boundary shows diminishing momentum from sellers, while buyers begin stepping in at increasingly higher levels, creating a compression zone.
This is a textbook "coiling setup", often suggesting a market indecision that leads to a breakout once one side dominates — in this case, the bulls.
🔍 Detailed Structure Analysis:
✅ Upper Trendline (Resistance):
Connects the swing highs at ~1.0890, ~1.0860, and ~1.0835
Downward sloping, forming the top boundary of the wedge
✅ Lower Trendline (Support):
Connects the lower lows at ~1.0785, ~1.0775, and ~1.0760
Slightly steeper angle compared to the resistance line
✅ Apex & Compression:
The range tightens as price coils into the apex
This contraction hints at a volatility expansion phase to follow
✅ Volume Context (If Available):
Volume tends to decrease during wedge development
Breakout typically sees a spike in volume, confirming participation
🔔 Breakout Confirmation:
Price breaks and closes above the upper wedge trendline at ~1.0830
Bullish candle with strong body signals buy-side control
Retest of breakout area acts as new support, enhancing the setup's strength
🎯 Trade Setup & Scenario Planning:
Setup Element Details
Entry Zone 1.0830–1.0840 (post-breakout confirmation)
Stop Loss (SL) 1.0760 (below wedge support and swing low)
Take Profit 1 (TP1) 1.0995 – Near previous structural resistance
Take Profit 2 (TP2) 1.1455 – Projected target (measured move)
Risk-to-Reward Ratio Approx. 1:3+ (ideal for swing setups)
🧮 Measured Move Target Logic:
Wedge Height: ~160 pips (1.0940 – 1.0780)
Breakout Level: ~1.0830
Target Projection: 1.0830 + 160 = 1.0990–1.1000, with potential extension to 1.1455
🔑 Confluence & Supporting Evidence:
Bullish Divergence on RSI (lower lows in price, higher lows in RSI)
Breakout occurs at a key psychological zone near 1.0800
Support zone retest = high-confidence re-entry point
MACD crossover near the breakout zone (if applicable)
Candlestick structure signals momentum shift (bullish engulfing/breakout bar)
🧭 Trader’s Mindset & Risk Notes:
Use dynamic position sizing to manage risk (1–2% per trade)
Ideal conditions for scaling into the trade after retest confirmation
Be mindful of news events (ECB/US data) that could cause volatility
Avoid chasing after the move if missed; wait for pullbacks or re-tests
📘 Conclusion:
This Falling Wedge breakout on EUR/USD is a classic example of a reversal structure unfolding after trend exhaustion. Price action confirms the shift in momentum through a strong bullish breakout, offering traders a clean technical setup with favorable risk-reward.
With confluence from RSI divergence, structure breakout, and clean trendline compression, this chart supports a bullish continuation narrative with near-term targets around 1.0995 and long-term potential towards 1.1455.
Related publications
Disclaimer
The information and publications are not meant to be, and do not constitute, financial, investment, trading, or other types of advice or recommendations supplied or endorsed by TradingView. Read more in the Terms of Use.
Related publications
Disclaimer
The information and publications are not meant to be, and do not constitute, financial, investment, trading, or other types of advice or recommendations supplied or endorsed by TradingView. Read more in the Terms of Use.