I have analysis for shorting this pair. Let's break down my reasons and see if we can confirm them:
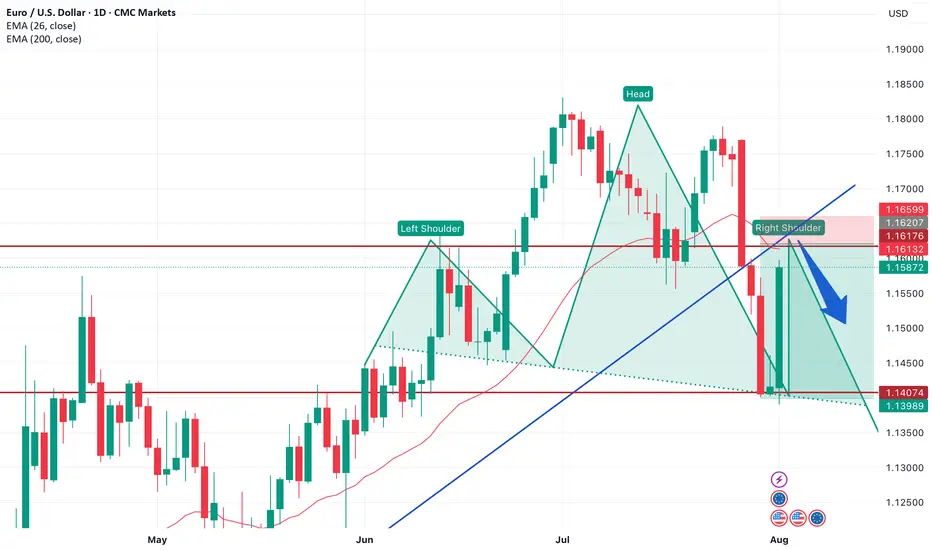
1. **Broken Trendline**: the blue trendline has been broken and that the price attempted to retrace back to it. A broken trendline can indicate a shift in market sentiment. If the price indeed retraces to the trendline and shows signs of rejection (like forming a bearish candlestick pattern), it could reinforce my bearish outlook.
2. **Head and Shoulders Pattern**: The head and shoulders pattern is a classic bearish reversal pattern. If the pattern is forming and the price is approaching the neckline, a break below this level could lead to a significant downward move. It's essential to ensure that the volume supports this pattern's validity, as higher volume on the breakout can strengthen the signal.
3. **EMA 26 Interaction**: The exponential moving average (EMA) can act as a dynamic resistance or support level. If the price is approaching the EMA 26 and has historically rejected there, it could serve as a potential area to look for short entries. Watching for bearish candlestick patterns or signs of weakness around this EMA can help confirm my trade.
Disclaimer
The information and publications are not meant to be, and do not constitute, financial, investment, trading, or other types of advice or recommendations supplied or endorsed by TradingView. Read more in the Terms of Use.
Disclaimer
The information and publications are not meant to be, and do not constitute, financial, investment, trading, or other types of advice or recommendations supplied or endorsed by TradingView. Read more in the Terms of Use.