Chart Overview:
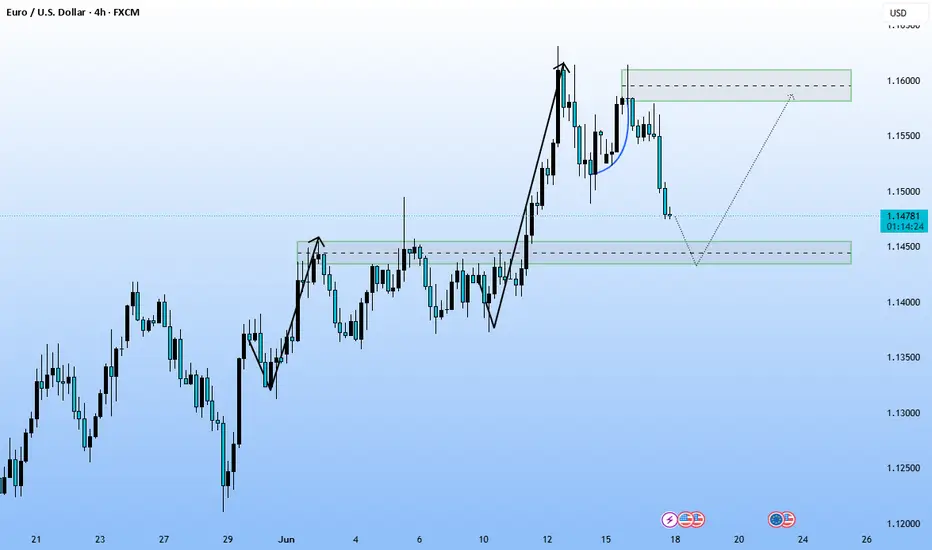
Current Price: Approximately 1.14706
Timestamp: June 18, 2025, 4:39 AM (UTC)
Candlestick Chart: Displays a recent decline after a strong bullish run.
Key Features:
🟩
Support Zone:
Around the 1.14400 – 1.14600 region.
Price is currently hovering just above this area, suggesting it may act as a potential reversal or bounce zone.
🟩
Resistance Zone:
Near 1.15800 – 1.16000
Marked as the bullish target in the projection.
Pattern & Projection:
A strong impulsive bullish move occurred earlier (highlighted with a bold arrow).
Followed by a correction or retracement, which is currently playing out.
There is a cup-like shape (possibly a rounded retest) indicating a prior consolidation before the impulse.
The white arrow projection suggests:
Price may retest the support zone around 1.14500.
Then potentially bounce up toward the resistance zone near 1.16000.
Interpretation:
This is a bullish continuation scenario, expecting the retracement to find support and lead to another upward leg.
The key level to watch is the support zone at 1.14500 — a break below could invalidate the bullish setup.
The chart implies a potential long entry opportunity near support with a target near 1.16000.
Disclaimer
The information and publications are not meant to be, and do not constitute, financial, investment, trading, or other types of advice or recommendations supplied or endorsed by TradingView. Read more in the Terms of Use.
Disclaimer
The information and publications are not meant to be, and do not constitute, financial, investment, trading, or other types of advice or recommendations supplied or endorsed by TradingView. Read more in the Terms of Use.