EUR/USD (1H timeframe)
1. Downtrend Channel (Left Side)
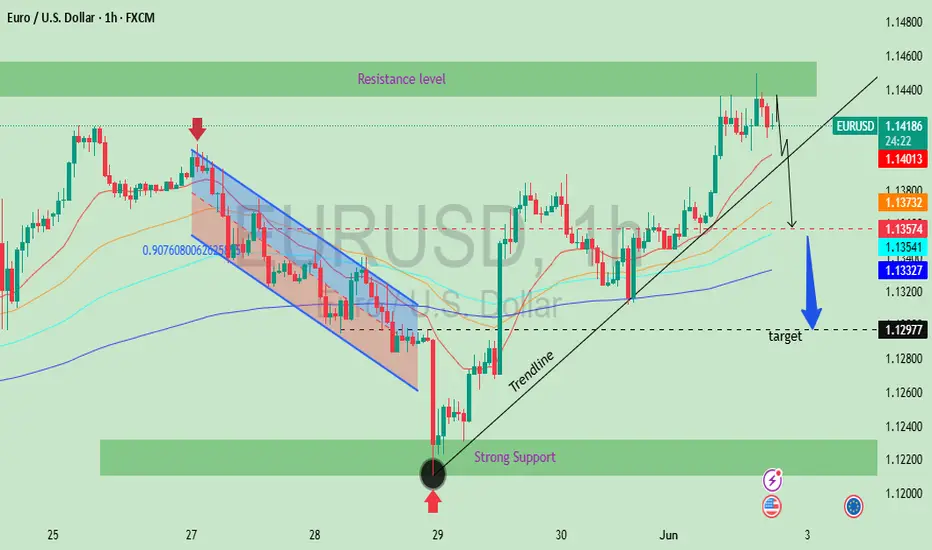
The pair was in a strong downtrend, indicated by a descending parallel channel (highlighted in red/blue).
Price made lower highs and lower lows, confirming bearish control.
The move ended around June 29, where the price entered a strong support zone.
2. Strong Support Zone (Marked Green Area)
This zone acted as a key demand area.
Once price reached this level, it formed a bullish reversal candle (shown with pink arrow).
The sharp bounce indicates buyer interest and exhaustion of selling pressure.
3. Bullish Reversal and Trendline
After hitting the support, the price made a strong upward move, breaking out of the downtrend.
A new uptrend was formed, with higher highs and higher lows, supported by a well-drawn ascending trendline.
This trendline acted as dynamic support during the bullish move.
4. Resistance Zone (Top Green Band)
Price eventually approached a resistance zone near 1.1420.
This area had previously capped bullish advances.
After testing resistance, price showed bearish signs, suggesting rejection.
5. Bearish Rejection & Potential Breakdown
Your chart correctly forecasts a potential break below the trendline.
If the trendline fails, a bearish continuation could occur.
A target level is marked below near 1.1275, aligning with previous support levels.
1. Downtrend Channel (Left Side)
The pair was in a strong downtrend, indicated by a descending parallel channel (highlighted in red/blue).
Price made lower highs and lower lows, confirming bearish control.
The move ended around June 29, where the price entered a strong support zone.
2. Strong Support Zone (Marked Green Area)
This zone acted as a key demand area.
Once price reached this level, it formed a bullish reversal candle (shown with pink arrow).
The sharp bounce indicates buyer interest and exhaustion of selling pressure.
3. Bullish Reversal and Trendline
After hitting the support, the price made a strong upward move, breaking out of the downtrend.
A new uptrend was formed, with higher highs and higher lows, supported by a well-drawn ascending trendline.
This trendline acted as dynamic support during the bullish move.
4. Resistance Zone (Top Green Band)
Price eventually approached a resistance zone near 1.1420.
This area had previously capped bullish advances.
After testing resistance, price showed bearish signs, suggesting rejection.
5. Bearish Rejection & Potential Breakdown
Your chart correctly forecasts a potential break below the trendline.
If the trendline fails, a bearish continuation could occur.
A target level is marked below near 1.1275, aligning with previous support levels.
Disclaimer
The information and publications are not meant to be, and do not constitute, financial, investment, trading, or other types of advice or recommendations supplied or endorsed by TradingView. Read more in the Terms of Use.
Disclaimer
The information and publications are not meant to be, and do not constitute, financial, investment, trading, or other types of advice or recommendations supplied or endorsed by TradingView. Read more in the Terms of Use.