📊 Technical Analysis Overview (Daily Timeframe)
After months of persistent downtrend pressure since late 2024, FLUX/USDT has finally flashed a high-probability bullish reversal signal. The recent breakout above a long-standing descending trendline may mark the beginning of a new bullish structure that could fuel an explosive upside move.
🔍 Market Structure & Technical Pattern
✅ Descending Trendline Breakout:
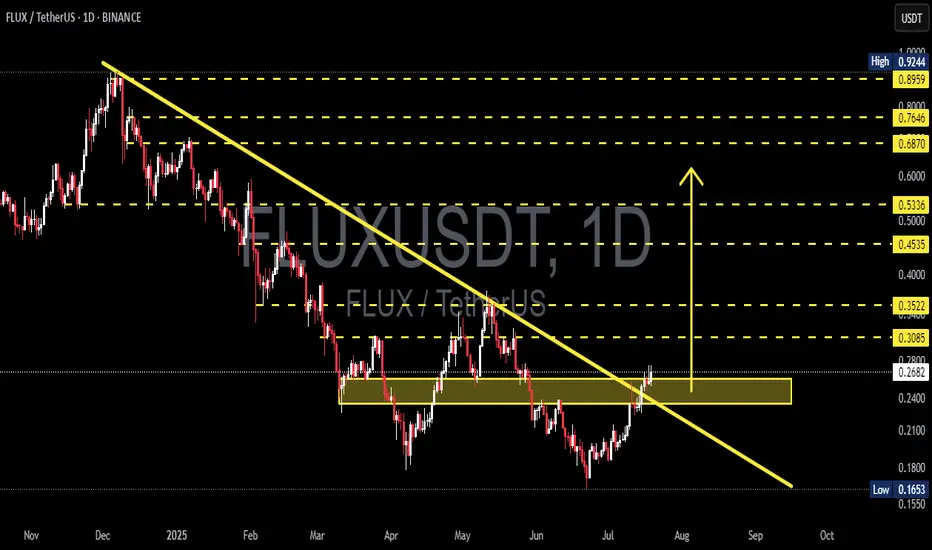
FLUX has successfully broken out of the dominant bearish trendline that has acted as resistance since December 2024. This breakout is an early sign of a trend reversal, shifting momentum in favor of the bulls.
✅ Demand Zone Reclaim (0.22 – 0.26 USDT):
This critical horizontal range has served as both support and resistance in recent months. Price has now reclaimed this zone with strength, indicating renewed buying pressure and a possible shift into accumulation or markup phase.
✅ Bullish Breakout Candle:
A strong bullish candle has closed above both the descending trendline and the demand zone, confirming breakout strength and increasing the odds of bullish continuation.
✅ Potential Bullish Continuation Setup:
If the price holds above 0.26 and prints a higher low, this will likely confirm a bullish structure and support a continuation move toward key resistance levels.
📈 Bullish Scenario – Potential Upside Targets
Should bullish momentum sustain, here are the major resistance levels to watch:
1. 0.3085 USDT – Immediate resistance zone.
2. 0.3522 USDT – Historical horizontal resistance.
3. 0.4535 – 0.5336 USDT – Consolidation range from Q1 2025.
4. 0.6870 USDT – Psychological level and potential Fibonacci confluence.
5. 0.7646 – 0.8959 USDT – Long-term bullish target, up to +200% from current levels.
📌 Note: A breakout supported by strong volume will add greater confirmation to the bullish thesis.
📉 Bearish Scenario – Watch Out for a Fakeout
Although the breakout looks promising, risks remain:
If the price fails to hold above 0.26, it may result in a false breakout.
A break below 0.24 could push price back into the 0.20 – 0.22 USDT zone.
If selling intensifies, FLUX may retest the 0.1653 USDT low.
⚠️ Always manage risk. A re-entry below the broken support would invalidate the breakout setup.
📌 Summary Strategy:
✅ Confirmed breakout from multi-month downtrend structure.
🟨 Demand zone has flipped into support.
📈 Multiple upside targets with strong reward-to-risk potential.
⚠️ Watch for confirmation via volume and price retest behavior.
#FLUXUSDT #CryptoBreakout #AltcoinAnalysis #FLUX #TechnicalAnalysis #TrendReversal #CryptoTrading #TradingViewTA #PriceAction #CryptoBulls
✅ Get Free Signals! Join Our Telegram Channel Here: t.me/TheCryptoNuclear
✅ Twitter: twitter.com/crypto_nuclear
✅ Join Bybit : partner.bybit.com/b/nuclearvip
✅ Benefits : Lifetime Trading Fee Discount -50%
✅ Twitter: twitter.com/crypto_nuclear
✅ Join Bybit : partner.bybit.com/b/nuclearvip
✅ Benefits : Lifetime Trading Fee Discount -50%
Disclaimer
The information and publications are not meant to be, and do not constitute, financial, investment, trading, or other types of advice or recommendations supplied or endorsed by TradingView. Read more in the Terms of Use.