There are a lot of sell confluences for this pair in all timeframes.
Here are the reasons for my bias:
- First of all, there was a very strong 3 month target that was hit at 2.1050 on 4th April
- Price hit a major monthly and 3M level at 2.1500 and we saw sharp rejections of that rejection.
- The monthly candlestick is looking to close very bearish since there is a long wick that has rejected the 2.1500 region
- 2.03 is a major monthly level that was broken but was never retested. I believe that price is due for a retest now.
- On the weekly timeframe, there is a bearish candlestick formation which is followed by last week's small indecision candlestick.
-Whenever we see an indecision candlestick, it usually means that price is collecting orders before we see a major move to either direction.
- I believe that the indecision candlestick is meant to indicate that price is headed lower.
- On the daily timeframe, Friday (11th April) candlestick is clearly bearish indicating that price is headed lower.
- Price has been consolidating for quite sometime indicating that orders are being collected.
- The next notable region on the daily timeframe is at 2.0600, which I believe we will see this week.
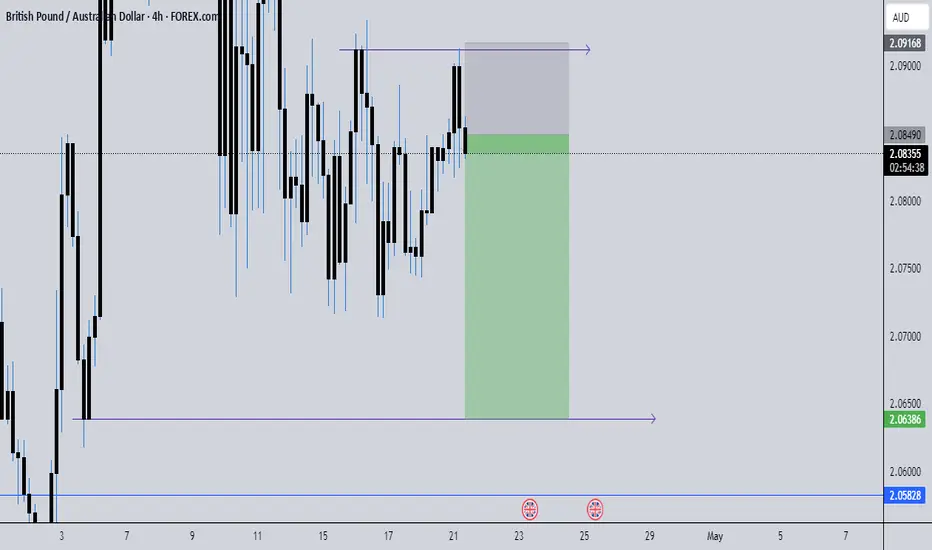
- I am currently in a sell setup since the 4h and 1h timeframe have confirmed my bias
- Price on the 4 hour has hit a major liquidity region at 2.09 where we have seen bearish rejections in previous price action
- Price has formed an entry on the 1 hour timeframe by forming a double top with a huge bearish rejection
- My take profit is at 2.0640, as this is the next major liquidity region.
Here are the reasons for my bias:
- First of all, there was a very strong 3 month target that was hit at 2.1050 on 4th April
- Price hit a major monthly and 3M level at 2.1500 and we saw sharp rejections of that rejection.
- The monthly candlestick is looking to close very bearish since there is a long wick that has rejected the 2.1500 region
- 2.03 is a major monthly level that was broken but was never retested. I believe that price is due for a retest now.
- On the weekly timeframe, there is a bearish candlestick formation which is followed by last week's small indecision candlestick.
-Whenever we see an indecision candlestick, it usually means that price is collecting orders before we see a major move to either direction.
- I believe that the indecision candlestick is meant to indicate that price is headed lower.
- On the daily timeframe, Friday (11th April) candlestick is clearly bearish indicating that price is headed lower.
- Price has been consolidating for quite sometime indicating that orders are being collected.
- The next notable region on the daily timeframe is at 2.0600, which I believe we will see this week.
- I am currently in a sell setup since the 4h and 1h timeframe have confirmed my bias
- Price on the 4 hour has hit a major liquidity region at 2.09 where we have seen bearish rejections in previous price action
- Price has formed an entry on the 1 hour timeframe by forming a double top with a huge bearish rejection
- My take profit is at 2.0640, as this is the next major liquidity region.
Disclaimer
The information and publications are not meant to be, and do not constitute, financial, investment, trading, or other types of advice or recommendations supplied or endorsed by TradingView. Read more in the Terms of Use.
Disclaimer
The information and publications are not meant to be, and do not constitute, financial, investment, trading, or other types of advice or recommendations supplied or endorsed by TradingView. Read more in the Terms of Use.