GBP/JPY Reversal Zone – High Probability Sell Setup on 4H Chart
Based on the chart for GBP/JPY (4H timeframe), here's a clear breakdown of the sell analysis pattern:
📉 Chart Overview:
Pair: GBP/JPY
Timeframe: 4H (OANDA feed)
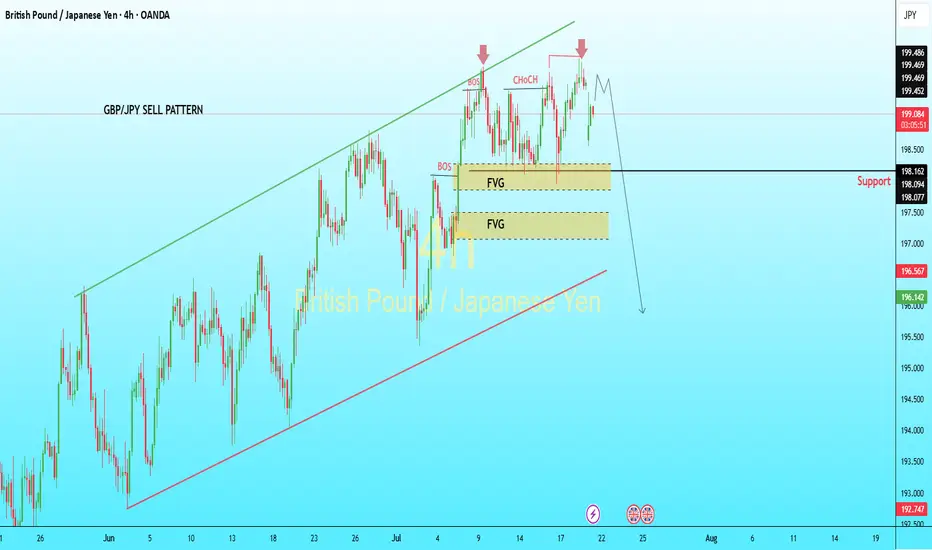
Current Price: ~199.10
Pattern Type: Sell Pattern within a rising channel
📌 Key Elements in the Chart:
1. Structure:
Rising Channel: Price is moving within a bullish channel.
Double Top Formation (highlighted with red arrows): Indicates potential reversal.
2. Important Levels:
Break of Structure (BOS) and Change of Character (ChoCH): Signal potential shift from bullish to bearish.
Fair Value Gaps (FVG): Two yellow zones marked below current price (~198.1 and ~196.5). These act as potential target areas for sell entries or price magnets.
3. Support Zone:
Horizontal support labeled around 198.00–198.16.
If price breaks below this, more downside is expected.
4. Bearish Projection:
Expected move: Break below support → Fill FVGs → Test lower trendline (possibly around 196.0 or even 194.0).
✅ Sell Strategy Suggestion:
Entry Zone: Around 199.10–199.40 (if price retests the highs)
Confirmation: Bearish candlestick pattern or break of short-term low
Stop Loss: Above recent high (~199.50–199.60)
Targets:
TP1: 198.16 (Support zone)
TP2: 196.50 (2nd FVG)
TP3: 194.00 (lower channel support)
⚠️ Notes:
Watch for reaction at support (198.00) — a bounce could signal short-term range.
Ideal to wait for bearish confirmation if not already in the trade.
📉 Chart Overview:
Pair: GBP/JPY
Timeframe: 4H (OANDA feed)
Current Price: ~199.10
Pattern Type: Sell Pattern within a rising channel
📌 Key Elements in the Chart:
1. Structure:
Rising Channel: Price is moving within a bullish channel.
Double Top Formation (highlighted with red arrows): Indicates potential reversal.
2. Important Levels:
Break of Structure (BOS) and Change of Character (ChoCH): Signal potential shift from bullish to bearish.
Fair Value Gaps (FVG): Two yellow zones marked below current price (~198.1 and ~196.5). These act as potential target areas for sell entries or price magnets.
3. Support Zone:
Horizontal support labeled around 198.00–198.16.
If price breaks below this, more downside is expected.
4. Bearish Projection:
Expected move: Break below support → Fill FVGs → Test lower trendline (possibly around 196.0 or even 194.0).
✅ Sell Strategy Suggestion:
Entry Zone: Around 199.10–199.40 (if price retests the highs)
Confirmation: Bearish candlestick pattern or break of short-term low
Stop Loss: Above recent high (~199.50–199.60)
Targets:
TP1: 198.16 (Support zone)
TP2: 196.50 (2nd FVG)
TP3: 194.00 (lower channel support)
⚠️ Notes:
Watch for reaction at support (198.00) — a bounce could signal short-term range.
Ideal to wait for bearish confirmation if not already in the trade.
Trade active
ActiveJOIN MY TELEGRAM:
FREE SIGNALS TECHNICAL CHART AND EDUCATOIN
t.me/+j_sv6p9sL5I0MDY0
FREE SIGNALS TECHNICAL CHART AND EDUCATOIN
t.me/+j_sv6p9sL5I0MDY0
Disclaimer
The information and publications are not meant to be, and do not constitute, financial, investment, trading, or other types of advice or recommendations supplied or endorsed by TradingView. Read more in the Terms of Use.
JOIN MY TELEGRAM:
FREE SIGNALS TECHNICAL CHART AND EDUCATOIN
t.me/+j_sv6p9sL5I0MDY0
FREE SIGNALS TECHNICAL CHART AND EDUCATOIN
t.me/+j_sv6p9sL5I0MDY0
Disclaimer
The information and publications are not meant to be, and do not constitute, financial, investment, trading, or other types of advice or recommendations supplied or endorsed by TradingView. Read more in the Terms of Use.