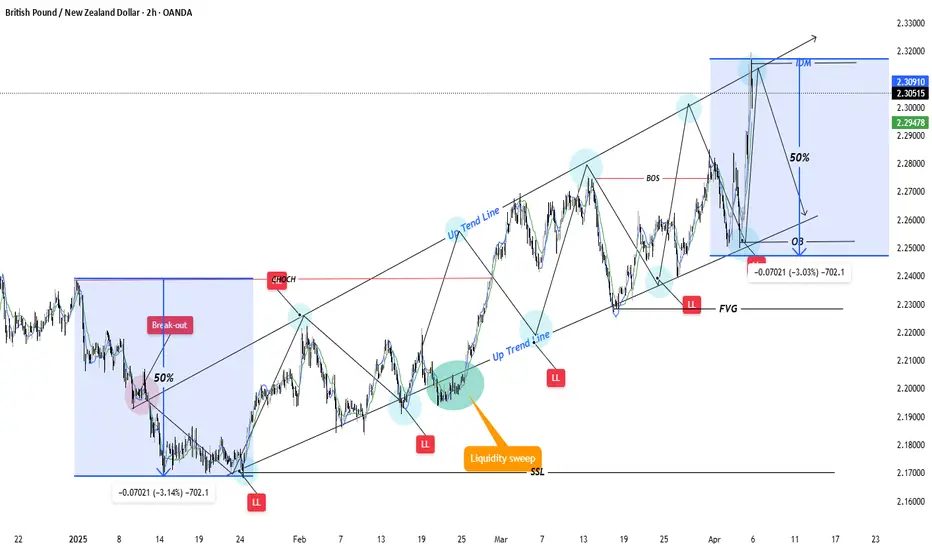
This chart of the *GBP/NZD (British Pound/New Zealand Dollar)* on the 2-hour timeframe uses a variety of technical analysis tools and concepts from *Smart Money Concepts (SMC)* and *market structure analysis*. Here's a breakdown of the tools and patterns used:
---
### *1. Market Structure Concepts*
- *LL (Lower Low), HL (Higher Low), BOS (Break of Structure), CHOCH (Change of Character)*
These are key components in identifying trend direction and shifts in structure.
---
### *2. Liquidity Concepts*
- *Liquidity Sweep*
A highlighted move (orange label) where price sweeps below a previous low (likely to take out stop-loss orders) before moving in the opposite direction.
- *SSL (Sell-Side Liquidity)*
The label under a swing low indicates liquidity below that level, which gets swept.
---
### *3. Fair Value Gap (FVG)*
- Marked in the chart as *FVG* — a gap between candles where price has moved quickly, typically an imbalance that price might return to fill.
---
### *4. Order Block (OB)*
- Seen toward the right side of the chart — a zone where price is expected to return before a potential continuation.
---
### *5. Trendlines*
- *Up Trend Line*
Used to show higher lows and structure support within the uptrend.
---
### *6. IDM (Institutional Dealing Range)*
- The large blue box on the right with the label "IDM" — indicates a potential range used by institutions, marked with a 50% retracement level.
---
### *7. Breakout Box*
- On the left side of the chart, a blue box marked "Break-out" showing a consolidation range and subsequent breakout.
---
### *8. Price Projections*
- The large blue boxes with percentage projections (e.g., 3.03%) and measured moves give a forecast for potential retracement or continuation targets.
---
### *Other Tools & Indicators Visible:*
- *50% Levels*: Midpoints of ranges or IDM zones.
- *Blue Zones*: Highlighted areas of consolidation or important price zones.
- *Rectangles and Arrows*: Visually tracking swing points, trends, and projected paths.
---
This chart reflects advanced price action trading with a strong focus on institutional concepts and order flow. Do you want help analyzing this specific setup or identifying potential trade ideas?
---
### *1. Market Structure Concepts*
- *LL (Lower Low), HL (Higher Low), BOS (Break of Structure), CHOCH (Change of Character)*
These are key components in identifying trend direction and shifts in structure.
---
### *2. Liquidity Concepts*
- *Liquidity Sweep*
A highlighted move (orange label) where price sweeps below a previous low (likely to take out stop-loss orders) before moving in the opposite direction.
- *SSL (Sell-Side Liquidity)*
The label under a swing low indicates liquidity below that level, which gets swept.
---
### *3. Fair Value Gap (FVG)*
- Marked in the chart as *FVG* — a gap between candles where price has moved quickly, typically an imbalance that price might return to fill.
---
### *4. Order Block (OB)*
- Seen toward the right side of the chart — a zone where price is expected to return before a potential continuation.
---
### *5. Trendlines*
- *Up Trend Line*
Used to show higher lows and structure support within the uptrend.
---
### *6. IDM (Institutional Dealing Range)*
- The large blue box on the right with the label "IDM" — indicates a potential range used by institutions, marked with a 50% retracement level.
---
### *7. Breakout Box*
- On the left side of the chart, a blue box marked "Break-out" showing a consolidation range and subsequent breakout.
---
### *8. Price Projections*
- The large blue boxes with percentage projections (e.g., 3.03%) and measured moves give a forecast for potential retracement or continuation targets.
---
### *Other Tools & Indicators Visible:*
- *50% Levels*: Midpoints of ranges or IDM zones.
- *Blue Zones*: Highlighted areas of consolidation or important price zones.
- *Rectangles and Arrows*: Visually tracking swing points, trends, and projected paths.
---
This chart reflects advanced price action trading with a strong focus on institutional concepts and order flow. Do you want help analyzing this specific setup or identifying potential trade ideas?
Join Telegram Channel Free t.me/+lvC6DGTZAqk3NTI8 "Explore daily insights: 4/5 signals meticulously analyzed, ensuring an impressive 99% accuracy in forex & crypto trades t.me/+XHUwVU1EKek0Nzlk
Disclaimer
The information and publications are not meant to be, and do not constitute, financial, investment, trading, or other types of advice or recommendations supplied or endorsed by TradingView. Read more in the Terms of Use.