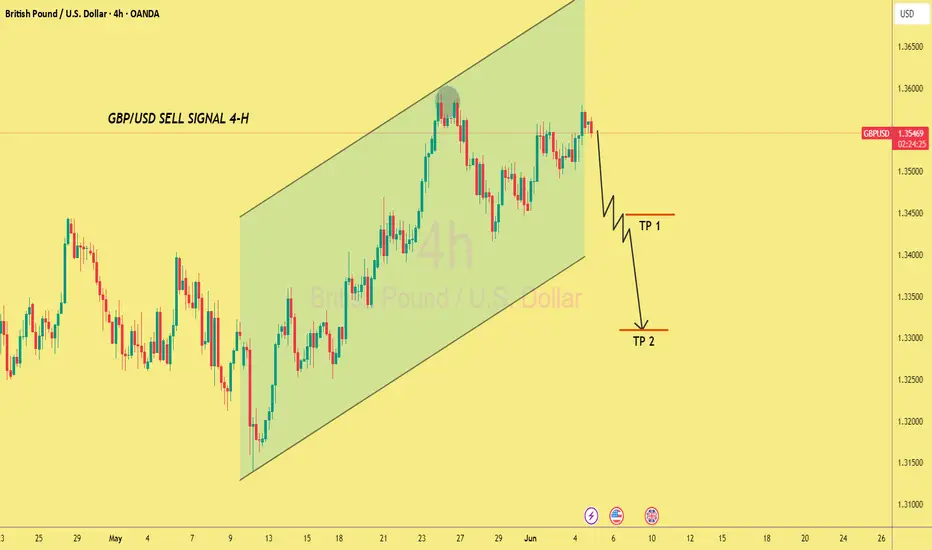
My GBP/USD 4-hour chart analysis clearly presents a bearish outlook with a "Sell Signal" identified at the top of the rising channel. Here's a breakdown of the technical insight we're working with:
🔍 Chart Analysis Summary:
Trend Channel: Price had been moving within an ascending channel.
Sell Trigger: The pair is now testing the upper boundary of the channel and has shown rejection, implying potential downward movement.
Projected Targets:
TP 1 (Take Profit 1): Around 1.3430 - 1.3450 region (based on visual).
TP 2 (Take Profit 2): Around 1.3300 - 1.3320 zone.
Candle Patterns: It appears there was a bearish engulfing or rejection wick at the resistance, suggesting bearish momentum may be gaining strength.
Price at Time of Chart: ~1.3545
✅ Strategy Implications:
Entry Zone: Near 1.3545 (current level).
Stop-Loss Suggestion: Slightly above the recent swing high or the channel top (~1.3590–1.3620 area).
Risk-Reward Ratio: Appears favourable if TP 2 is targeted, especially with a tight stop loss.
⚠️ Caution:
Always confirm with additional signals (e.g., RSI divergence, volume, or fundamental news).
Watch out for false breakouts or consolidation before the drop.
Would you like help calculating a precise stop-loss and take-profit setup based on pip values or risk management ratios (like 1:2 or 1:3)?
Disclaimer
The information and publications are not meant to be, and do not constitute, financial, investment, trading, or other types of advice or recommendations supplied or endorsed by TradingView. Read more in the Terms of Use.
Disclaimer
The information and publications are not meant to be, and do not constitute, financial, investment, trading, or other types of advice or recommendations supplied or endorsed by TradingView. Read more in the Terms of Use.
