GBP/USD – Bearish Breakdown from Rising Wedge | Textbook Rejection at Key Resistance
🔎 Detailed Technical Analysis – April 23, 2025 | 30-Min Chart (OANDA: GBP/USD)
🧭 Market Context & Setup
The GBP/USD currency pair has recently completed a technical correction within a broader downtrend. This retracement phase developed into a Rising Wedge formation — a well-known bearish reversal or continuation pattern, especially when it occurs after a strong bearish impulse.
This setup presents an excellent example of how price action reacts to key support and resistance levels, while also showcasing the effectiveness of combining chart patterns with market structure.
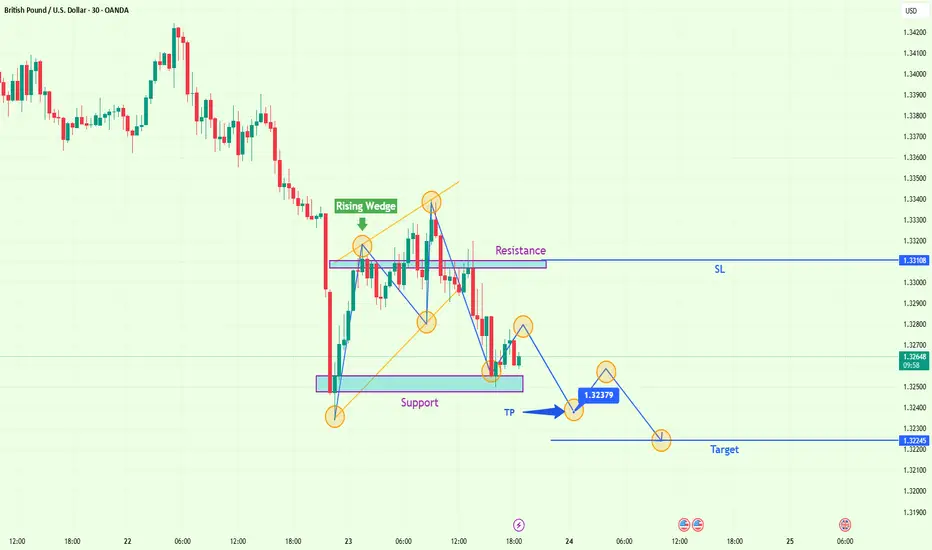
🖼️ Chart Pattern: Rising Wedge (Bearish Continuation)
The Rising Wedge appeared after a strong sell-off, where price temporarily corrected upward. This pattern is formed by a series of higher highs and higher lows within converging trendlines, suggesting weakening bullish momentum.
🔽 Breakdown Confirmation:
The wedge was confirmed with at least three touches on both the upper and lower trendlines.
Price broke down with a strong bearish candlestick, suggesting increasing momentum and triggering breakout sellers.
A brief pullback/retest occurred at the previous support of the wedge, now acting as resistance — a classic retest scenario before continuation.
📌 Key Levels Identified on the Chart
🔺 Resistance Zone: 1.3290 – 1.3310
This horizontal level has seen repeated rejections.
Sellers have clearly defended this zone, rejecting every bullish attempt.
Also aligns with the upper edge of the rising wedge, reinforcing confluence.
🔻 Support Zone: 1.3240 – 1.3250
Acts as both a psychological barrier and technical support.
The price is testing this area again post-breakdown.
A clean break below opens the path toward lower levels.
🎯 Target Level: 1.32245
Based on measured move from wedge height and prior structure low.
This is the final target where profit-taking is expected.
📍 Take Profit (TP): 1.32379
Intermediate take-profit level for partial exits or conservative targets.
🛡️ Stop Loss (SL): 1.33108
Placed just above the wedge and resistance zone to avoid false breakouts.
Any move above this level invalidates the bearish setup.
⚙️ Trade Idea and Management
This is a short setup based on a confirmed rising wedge breakdown.
Component Details
Entry On bearish retest or market order below 1.3260
Stop Loss (SL) 1.33108
Take Profit (TP1) 1.32379
Final Target (TP2) 1.32245
R:R Ratio ~1:2.5+ (ideal risk/reward)
📌 Note: The trade is valid as long as price remains below the 1.3310 resistance. If price closes above this level, the setup is invalidated.
📉 Price Action Highlights
The breakdown occurred after the third touch at resistance — a key signal that bulls were exhausted.
The pullback to retest former wedge support (turned resistance) failed to generate bullish momentum.
Candlestick structure shows lower highs and weaker bullish pushes, indicating strong selling pressure.
Support at 1.3245 is weakening, and a decisive break could trigger a continuation toward 1.32245.
📚 Confluence Factors Supporting the Short Bias
✅ Rising Wedge breakdown — a high-probability bearish pattern.
✅ Price rejection from a clearly defined resistance zone.
✅ Downtrend on higher timeframes providing macro-level confirmation.
✅ Lower highs following the wedge breakdown = bearish structure.
✅ Well-defined risk management with favorable R:R.
💡 Educational Insight: Why This Pattern Works
A Rising Wedge in a downtrend represents a consolidation of bullish efforts, but it forms against the prevailing trend. As the price rises with weakening momentum, smart money often positions for a breakdown. When sellers overwhelm buyers at the top, the wedge breaks, and price often falls sharply.
This pattern is often reinforced by trader psychology:
FOMO buying near the top,
Bull traps on failed breakouts,
Panic selling on breakdown confirmation.
✅ Summary
This GBP/USD setup provides a high-conviction, low-risk trade opportunity using classic technical principles. The chart pattern, resistance rejection, and bearish momentum suggest a strong continuation toward lower levels. It's a powerful example of how structured trading using patterns and zones can lead to consistent results.
🔎 Detailed Technical Analysis – April 23, 2025 | 30-Min Chart (OANDA: GBP/USD)
🧭 Market Context & Setup
The GBP/USD currency pair has recently completed a technical correction within a broader downtrend. This retracement phase developed into a Rising Wedge formation — a well-known bearish reversal or continuation pattern, especially when it occurs after a strong bearish impulse.
This setup presents an excellent example of how price action reacts to key support and resistance levels, while also showcasing the effectiveness of combining chart patterns with market structure.
🖼️ Chart Pattern: Rising Wedge (Bearish Continuation)
The Rising Wedge appeared after a strong sell-off, where price temporarily corrected upward. This pattern is formed by a series of higher highs and higher lows within converging trendlines, suggesting weakening bullish momentum.
🔽 Breakdown Confirmation:
The wedge was confirmed with at least three touches on both the upper and lower trendlines.
Price broke down with a strong bearish candlestick, suggesting increasing momentum and triggering breakout sellers.
A brief pullback/retest occurred at the previous support of the wedge, now acting as resistance — a classic retest scenario before continuation.
📌 Key Levels Identified on the Chart
🔺 Resistance Zone: 1.3290 – 1.3310
This horizontal level has seen repeated rejections.
Sellers have clearly defended this zone, rejecting every bullish attempt.
Also aligns with the upper edge of the rising wedge, reinforcing confluence.
🔻 Support Zone: 1.3240 – 1.3250
Acts as both a psychological barrier and technical support.
The price is testing this area again post-breakdown.
A clean break below opens the path toward lower levels.
🎯 Target Level: 1.32245
Based on measured move from wedge height and prior structure low.
This is the final target where profit-taking is expected.
📍 Take Profit (TP): 1.32379
Intermediate take-profit level for partial exits or conservative targets.
🛡️ Stop Loss (SL): 1.33108
Placed just above the wedge and resistance zone to avoid false breakouts.
Any move above this level invalidates the bearish setup.
⚙️ Trade Idea and Management
This is a short setup based on a confirmed rising wedge breakdown.
Component Details
Entry On bearish retest or market order below 1.3260
Stop Loss (SL) 1.33108
Take Profit (TP1) 1.32379
Final Target (TP2) 1.32245
R:R Ratio ~1:2.5+ (ideal risk/reward)
📌 Note: The trade is valid as long as price remains below the 1.3310 resistance. If price closes above this level, the setup is invalidated.
📉 Price Action Highlights
The breakdown occurred after the third touch at resistance — a key signal that bulls were exhausted.
The pullback to retest former wedge support (turned resistance) failed to generate bullish momentum.
Candlestick structure shows lower highs and weaker bullish pushes, indicating strong selling pressure.
Support at 1.3245 is weakening, and a decisive break could trigger a continuation toward 1.32245.
📚 Confluence Factors Supporting the Short Bias
✅ Rising Wedge breakdown — a high-probability bearish pattern.
✅ Price rejection from a clearly defined resistance zone.
✅ Downtrend on higher timeframes providing macro-level confirmation.
✅ Lower highs following the wedge breakdown = bearish structure.
✅ Well-defined risk management with favorable R:R.
💡 Educational Insight: Why This Pattern Works
A Rising Wedge in a downtrend represents a consolidation of bullish efforts, but it forms against the prevailing trend. As the price rises with weakening momentum, smart money often positions for a breakdown. When sellers overwhelm buyers at the top, the wedge breaks, and price often falls sharply.
This pattern is often reinforced by trader psychology:
FOMO buying near the top,
Bull traps on failed breakouts,
Panic selling on breakdown confirmation.
✅ Summary
This GBP/USD setup provides a high-conviction, low-risk trade opportunity using classic technical principles. The chart pattern, resistance rejection, and bearish momentum suggest a strong continuation toward lower levels. It's a powerful example of how structured trading using patterns and zones can lead to consistent results.
Related publications
Disclaimer
The information and publications are not meant to be, and do not constitute, financial, investment, trading, or other types of advice or recommendations supplied or endorsed by TradingView. Read more in the Terms of Use.
Related publications
Disclaimer
The information and publications are not meant to be, and do not constitute, financial, investment, trading, or other types of advice or recommendations supplied or endorsed by TradingView. Read more in the Terms of Use.