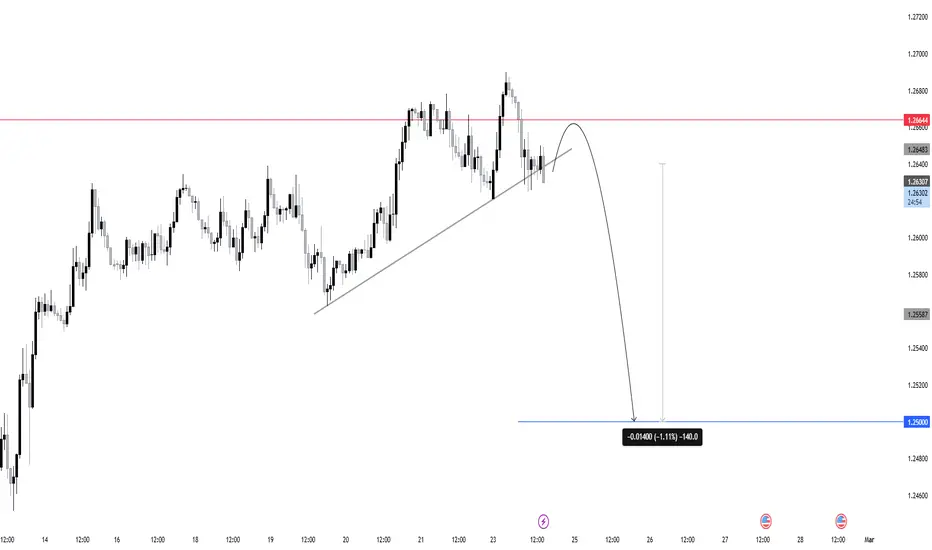
The chart highlights a key overhead resistance (red line). Price has tested this level and appears to be struggling to break above it decisively. This resistance zone is likely attracting sellers who are defending it vigorously.
After failing to break above the resistance, the market seems to be forming a lower high. This shift in structure can be an early warning of a bearish reversal, as buyers lose momentum and sellers begin to gain control.
The blue horizontal line marks a significant support zone. The chart’s projected path indicates a potential move down toward this area, suggesting that sellers might push the price lower if immediate support levels fail to hold.
iSmashProfit
Related publications
Disclaimer
The information and publications are not meant to be, and do not constitute, financial, investment, trading, or other types of advice or recommendations supplied or endorsed by TradingView. Read more in the Terms of Use.
iSmashProfit
Related publications
Disclaimer
The information and publications are not meant to be, and do not constitute, financial, investment, trading, or other types of advice or recommendations supplied or endorsed by TradingView. Read more in the Terms of Use.