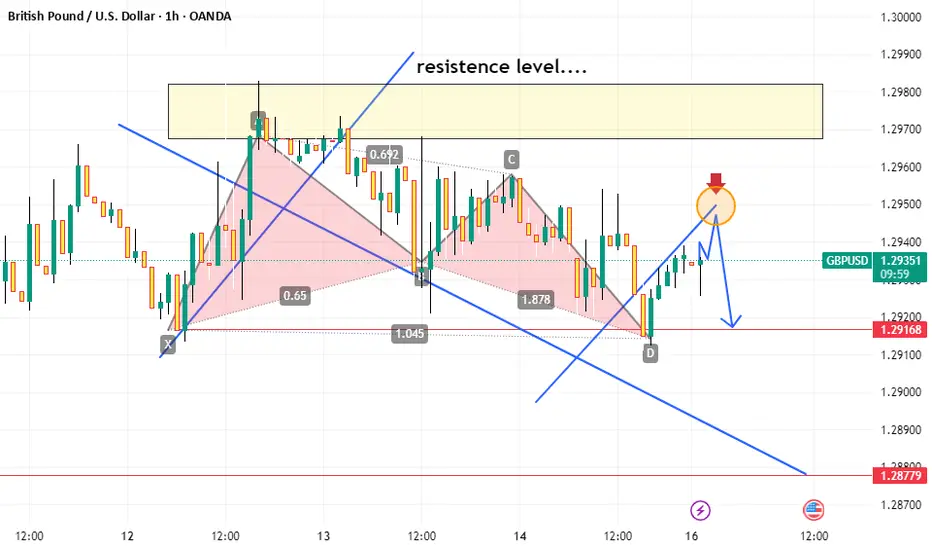
This chart is a technical analysis of the GBP/USD currency pair on the 1-hour timeframe. Here’s what it indicates:
Resistance Level (Yellow Box): The price has reached a resistance zone where sellers may enter the market.
Harmonic Pattern: The shaded pink pattern appears to represent a harmonic trading pattern, possibly a Gartley or Bat pattern, suggesting a reversal at certain Fibonacci levels.
Trendlines (Blue Lines): There are two diagonal trendlines, indicating possible price movements.
Potential Reversal (Red Arrow & Circle): The price is approaching a key level (highlighted by the orange circle and red arrow), suggesting a potential bearish reversal.
Projected Movement (Blue Arrows): The forecast suggests a possible minor upward move before price drops towards the support level at 1.29168 and possibly 1.28779.
Overall, the chart suggests that GBP/USD may face selling pressure near resistance and could decline.
Disclaimer
The information and publications are not meant to be, and do not constitute, financial, investment, trading, or other types of advice or recommendations supplied or endorsed by TradingView. Read more in the Terms of Use.
Disclaimer
The information and publications are not meant to be, and do not constitute, financial, investment, trading, or other types of advice or recommendations supplied or endorsed by TradingView. Read more in the Terms of Use.