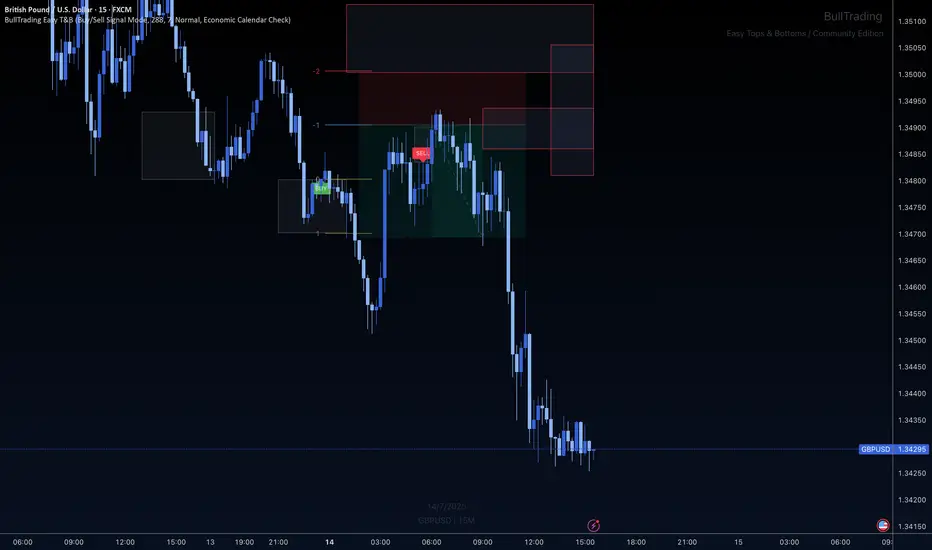
In this setup, GBP/USD broke down through a dynamic red zone printed by the BullTrading Easy Tops & Bottoms indicator (💥 Free for the entire community!).
This zone had previously acted as a potential resistance level, but price showed no respect on approach — instead, we saw strong acceleration through the level, confirming momentum and a liquidity imbalance.
🔍 Why This Mattered:
This indicator doesn’t predict — it highlights true dynamic support and resistance zones based on stop clustering and price behavior.
When price doesn’t respect a zone and breaks through it with strength, that alone tells a story:
When a support zone is broken, price will often rebalance ABOVE the same number of points/pips as the size of the zone itself — that’s your opportunity.
Smart money may be engineering a continuation move
The reaction after the zone is broken is key
In this case, the cleanest play was to use a SELL LIMIT above the broken support zone, and the market gave us clear bearish confirmation
📌 Educational Insight:
The edge isn’t just in the zones — it’s in how price reacts around them.
When a zone fails, it becomes a trigger point for directional bias.
Here, it offered a clean bearish confirmation to short the retest, with a precise stop-loss placed just above the broken structure.
✅ Lot sizing was adjusted based on the stop distance, usually 1:2 RR is optimal
Tighter SL = higher lot size
Wider SL = lower lot size
That keeps risk consistent and manageable.
Telegram: t.me/+GB-FGLPyaQJjYWQz YouTube: youtube.com/@gustavorubi3740 💻 BullTradingIndicators.com Note: If you are looking for V7 use this link: bulltradingindicators.com/registration
Disclaimer
The information and publications are not meant to be, and do not constitute, financial, investment, trading, or other types of advice or recommendations supplied or endorsed by TradingView. Read more in the Terms of Use.