Chart Description:
Market Context:
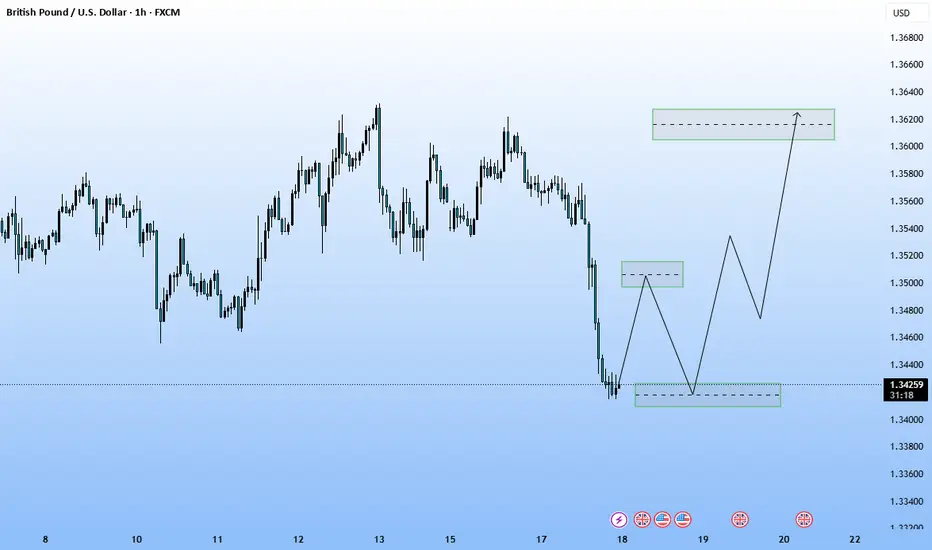
Recent sharp decline in price indicating a strong bearish leg.
Price is now in a potential reversal zone near a previously marked demand area (lower green box), around 1.34200–1.34400.
Projection Path:
Bullish Recovery Plan:
The chart suggests accumulation or reaccumulation in the current zone.
A possible series of higher lows and higher highs (indicated by the stair-step arrows) projecting:
First minor pullback and consolidation.
Then continuation towards a bullish target.
Target Zone:
The final target is a supply zone/resistance around 1.36000–1.36200 (green box above).
The price is expected to create internal structure before reaching this zone, possibly forming:
Internal CHoCH (change of character)
Followed by a break of structure (BOS).
Type of Analysis:
This is a smart money concept (SMC) or price action-based prediction.
Focuses on:
Liquidity grabs
Reversal structure
Demand and supply zones
Market Context:
Recent sharp decline in price indicating a strong bearish leg.
Price is now in a potential reversal zone near a previously marked demand area (lower green box), around 1.34200–1.34400.
Projection Path:
Bullish Recovery Plan:
The chart suggests accumulation or reaccumulation in the current zone.
A possible series of higher lows and higher highs (indicated by the stair-step arrows) projecting:
First minor pullback and consolidation.
Then continuation towards a bullish target.
Target Zone:
The final target is a supply zone/resistance around 1.36000–1.36200 (green box above).
The price is expected to create internal structure before reaching this zone, possibly forming:
Internal CHoCH (change of character)
Followed by a break of structure (BOS).
Type of Analysis:
This is a smart money concept (SMC) or price action-based prediction.
Focuses on:
Liquidity grabs
Reversal structure
Demand and supply zones
Disclaimer
The information and publications are not meant to be, and do not constitute, financial, investment, trading, or other types of advice or recommendations supplied or endorsed by TradingView. Read more in the Terms of Use.
Disclaimer
The information and publications are not meant to be, and do not constitute, financial, investment, trading, or other types of advice or recommendations supplied or endorsed by TradingView. Read more in the Terms of Use.