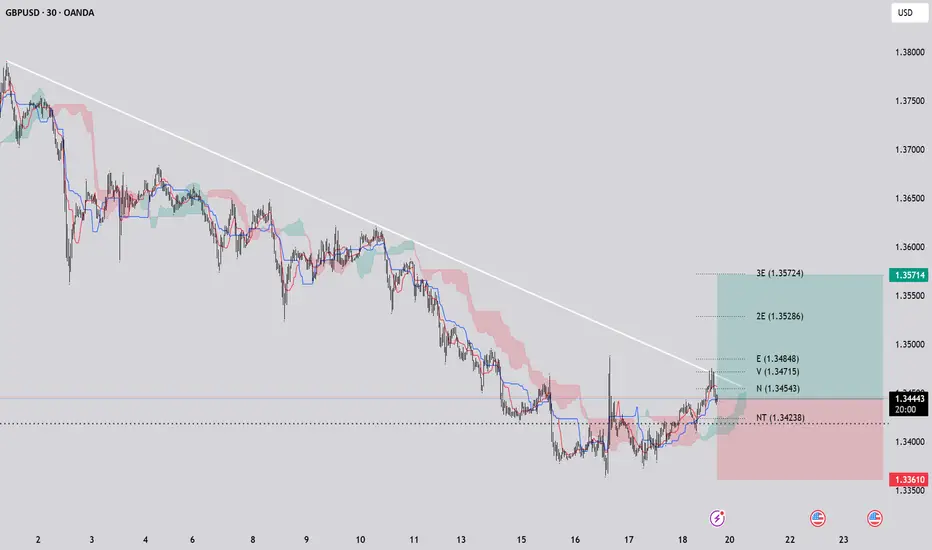
If the price breaks above the trendline, it could signal a reversal or a strong bullish momentum. In this scenario, the price may aim to test the nearest identified targets, which are marked as horizontal levels on the chart. These targets include zones around the upper boundaries of the shaded areas, potentially reaching the levels indicated by the upper trendline touchpoints or the previous highs within the observed range. The break's strength and accompanying volume would be key factors in determining whether these targets are realistically achievable.
If you like, please hint.
If you like, please hint.
Trade active
Targets N, V, E, 2E touched.
If you like, please hint.
Disclaimer
The information and publications are not meant to be, and do not constitute, financial, investment, trading, or other types of advice or recommendations supplied or endorsed by TradingView. Read more in the Terms of Use.
Disclaimer
The information and publications are not meant to be, and do not constitute, financial, investment, trading, or other types of advice or recommendations supplied or endorsed by TradingView. Read more in the Terms of Use.