Chart Overview:
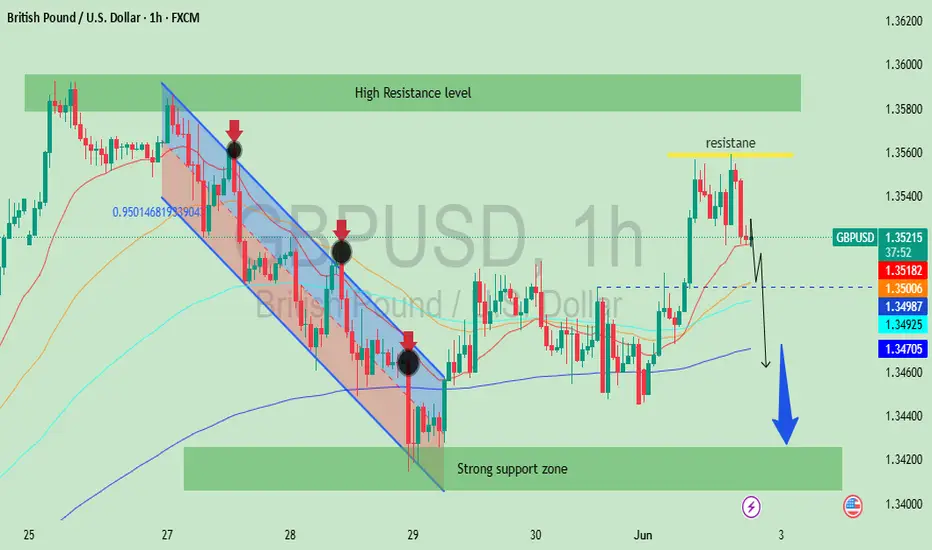
Currency Pair: GBP/USD
Timeframe: 1-hour (1h)
Analysis Type: Technical analysis with trend channels, support/resistance zones, and pattern forecasting
---
📉 Past Price Movement:
1. Bearish Trend Channel (Marked in Blue and Red):
Price moved consistently downward within a descending channel.
Red arrows mark lower highs, showing strong selling pressure at each rejection from the upper boundary of the channel.
The market respected the channel structure until the breakout.
2. Fibonacci Level:
The 0.5 Fibonacci level is marked, indicating a possible retracement or mid-point of a previous swing move.
It was respected during the downward move.
---
🔁 Trend Reversal Attempt:
After breaking above the descending channel, price showed a bullish move and rallied toward a horizontal resistance zone marked in yellow.
This rally signifies a potential trend reversal or correction after the extended downtrend.
---
📊 Key Levels:
1. High Resistance Level (Green Zone at Top):
Price faced heavy rejection at this zone, forming a top.
This area has been tested but not broken, showing strong selling pressure.
2. Immediate Resistance Line (Yellow):
Price formed a local top here and reversed, showing it's acting as a resistance again.
3. Strong Support Zone (Green Zone at Bottom):
Marked as a demand zone where price previously reversed.
This is a potential target if the bearish move continues.
---
📉 Current Price Action and Forecast:
Price touched the resistance line and showed bearish rejection (indicated by red candles).
A black arrow is drawn forecasting a downward move back toward the strong support zone.
This suggests the trader anticipates the resistance to hold and price to decline.
---
📌 Conclusion & Interpretation:
This chart represents a complete technical setup:
Past downtrend ✔
Channel breakout ✔
Retest of resistance ✔
Forecast of bearish continuation ✔
The setup assumes:
Rejection at resistance will hold
Price will head back to the support zone
---
✅ Suggested Trading Insight (Not financial advice):
Short Entry could be considered below recent support break with confirmation (e.g., bearish engulfing candle).
Target: Lower green support zone.
Stop Loss: Just above resistance zone to limit risk.
Disclaimer
The information and publications are not meant to be, and do not constitute, financial, investment, trading, or other types of advice or recommendations supplied or endorsed by TradingView. Read more in the Terms of Use.
Disclaimer
The information and publications are not meant to be, and do not constitute, financial, investment, trading, or other types of advice or recommendations supplied or endorsed by TradingView. Read more in the Terms of Use.