GBPUSD 1.5335: Breaks above 3-week falling trendline for higher
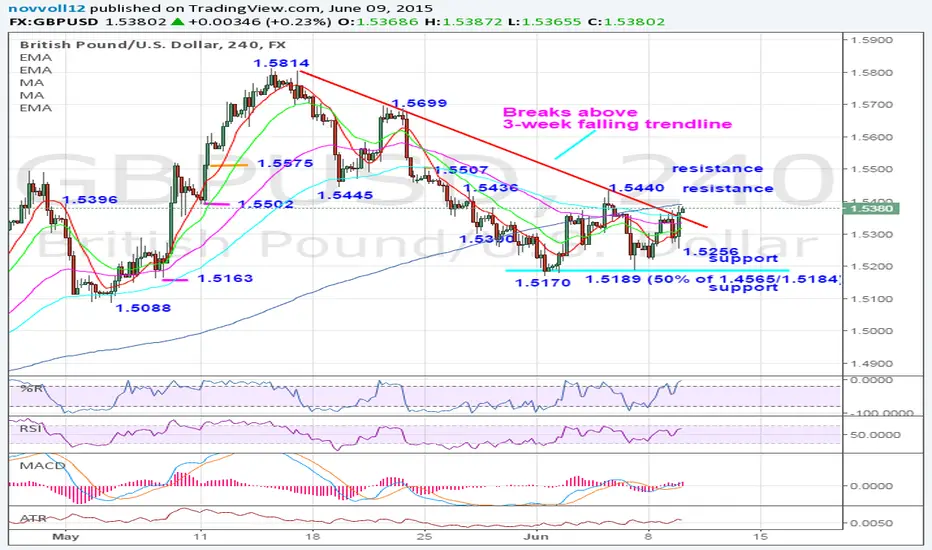
GBPUSD broke above a 3-week falling trendline (as shown on the 240 minute chart) to suggest basing over 1.5170 low (June 1, 2015 low). Clearing the 1.5440 high would confirm the double bottom over 1.5170/1.5189 (June 1/5, 2015 lows) and trigger further gains towards 1.5507 9May 25, 2015 high) next. Above there would open the 1.5699 lower high (May 21, 2015). However, back below 1.5256 (June 9, 2015 low) would negate the strength and shift the focus to 1.5170/1.5189.
Outlook:
Short term: bullish
Long term: neutral
Outlook:
Short term: bullish
Long term: neutral
Disclaimer
The information and publications are not meant to be, and do not constitute, financial, investment, trading, or other types of advice or recommendations supplied or endorsed by TradingView. Read more in the Terms of Use.
Disclaimer
The information and publications are not meant to be, and do not constitute, financial, investment, trading, or other types of advice or recommendations supplied or endorsed by TradingView. Read more in the Terms of Use.