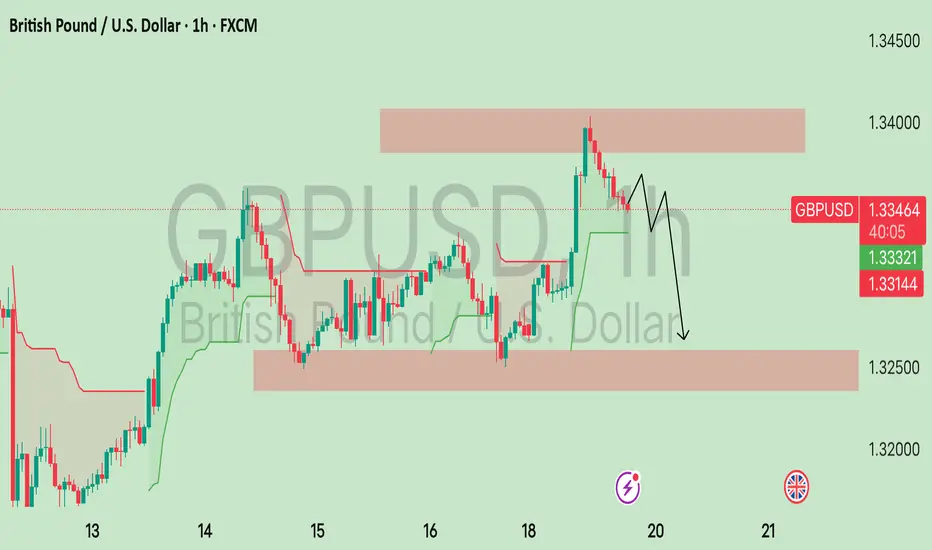
This chart represents the GBP/USD currency pair on a 1-hour timeframe, showing recent price movements and a potential future forecast. Here's a breakdown of the chart and its meaning:
Chart Description:
1. Currency Pair:
GBP/USD (British Pound vs. US Dollar)
2. Timeframe:
1-hour (each candlestick represents one hour of trading)
3. Current Price:
Around 1.33477
4. Highlighted Zones (in red shading):
Upper Zone (~1.34000 area): Resistance zone where price recently reversed.
Lower Zone (~1.32500 area): Support zone where price previously bounced up.
5. Price Action:
Price rose sharply and entered the resistance zone.
It got rejected from that zone and began to fall.
The chart includes a forecast path (black arrow) showing a likely bearish (downward) move, suggesting a potential drop towards the lower support zone.
6. Indicators Used:
Support & Resistance Zones: Highlighted rectangles.
Possibly an Envelope/MA Band (green/red lines): Indicating potential dynamic support/resistance or trend direction.
Disclaimer
The information and publications are not meant to be, and do not constitute, financial, investment, trading, or other types of advice or recommendations supplied or endorsed by TradingView. Read more in the Terms of Use.
Disclaimer
The information and publications are not meant to be, and do not constitute, financial, investment, trading, or other types of advice or recommendations supplied or endorsed by TradingView. Read more in the Terms of Use.