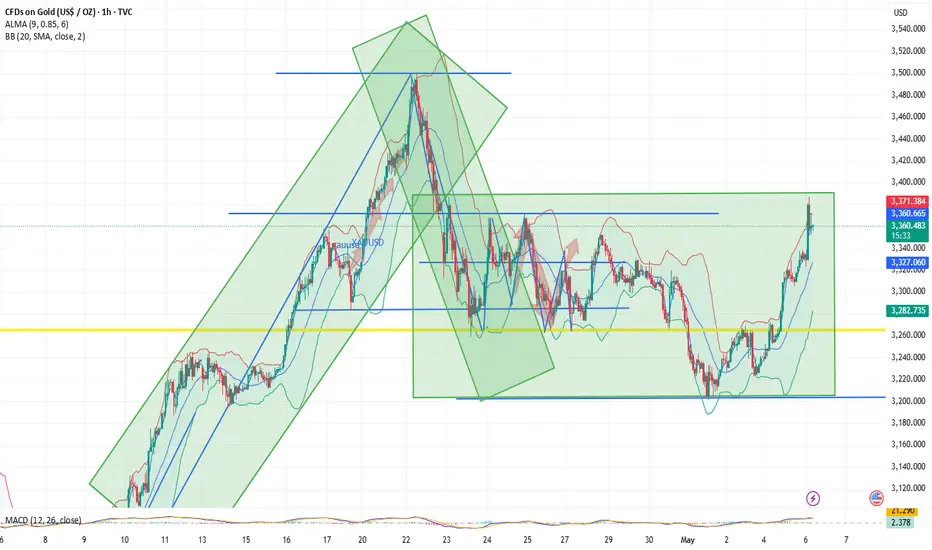
Spot gold continues to maintain a super-large shock pattern. Last Friday and yesterday, the Asian session rose sharply for two consecutive days. Pay attention to the continuation of the pattern! Before the peak and decline at the 3500 US dollar stage, the Asian session also rose sharply. After the peak at the 3500 stage, the Asian session fell sharply for 8 days. Last Friday, the falling pattern was broken and the rising pattern returned.
Yesterday, spot gold rose by 100 US dollars, and the daily line closed with a huge positive line. Yesterday, we emphasized that the London session will not fall, and the rising pattern must be maintained. If the 3270 area is broken, the 3310-20 range can be bullish; the London session can only be long at a low level, and shorting needs to be in the US session. The market is consistent with expectations. The bulls remain long before the US session. After the European session breaks through the 3270-72 area, the bulls accelerate the rise. The US session 3328 line falls to 3305 at the maximum, stabilizes, and then rises and breaks the high.
After yesterday's 100+ surge, the bulls are strong and continue to be bullish. The only unfavorable factor for bulls at present is that the indicator is seriously overbought in the short term. The key position of the day supports the low point of yesterday's US market at 3305-3300, which is also the watershed between long and short positions in the day; the key position of the morning market is 3325-22 area, which is the watershed between long and short positions! Relying on the intraday and early trading long and short boundaries, the early trading upward impact of the upper edge of last week's oscillation range at 3360-70 will further bullishly fall under pressure near 3385. In the follow-up points, continue to pay attention to the break above 86 and pay attention to the area above 3410-40! The Asian market's rising pattern is broken or the watershed is broken, and the market is weak! In terms of operation, it is still mainly low and long during the day, and the short position in the US market will make a correction.
Market analysis:
① The three-track shrinkage of the daily Bollinger band represents the compression and oscillation of the range. The indicator macd dead cross shrinks, and the smart indicator sto quickly repairs upward, representing the current trend of oscillation and rebound. And the candle chart rushed up yesterday and stood firm on the MA5 and MA10 moving averages, so it will continue to rush up to test the upper rail*, but the upper rail will continue to move down over time. The upper* is currently at 3461-3480. The support moving average and the middle rail correspond to the 3309-3295-3274 line.
Currently, the daily short-term focus is on the previous gap high point 3386.5*, and the 3424 line.
②The 4-hour indicator is still running at a high level, representing the bulls of the price. Currently, the upper rail and the MA5 moving average support correspond to the 3368-3344 line. According to the Fibonacci retracement line obtained from this round of decline, the upper* is currently at the 0.618 position 3385 line.
③The hourly MACD and STO are both at relatively high levels and can face retracement at any time. The hourly line is currently supported around 3335-37, 3322-20 and 3310. Combined with the short-term cycle, the current upper support is at 3362-3355 and 3372.
In summary:
The daily line will continue to rebound and test the upper track*, that is, it will definitely break the 3386 line; but today 3386 is also the *point we need to pay attention to.
Because we see that the daily line will continue to rise, today's retracement will not exceed the morning low of 3323. Therefore, the retracement of 3272-78 will continue to be delayed, so the best point for long orders today is definitely 3335-37. At present, it is too far away, so we need to find 3355 and 3362 and the current 3372 line.
Therefore, today's long orders can be held above 3400, and as long as it breaks through 3385-87, it can be reached today.
Strategy:
[1] Short around 3385-86, stop loss at 3389, target at 3374-3364 (after breaking through 3386-87, go long around 3374-76, defense at 3368, target at 3370-3385-3400-10-30
[2] Go long around 3251-53, defense at 3345, target at 3370-3385-340 0-10-30 "You can enter the market at the first retracement, but not at the second retracement"
[3] Buy near 3330-35 during the day, defend 3320, and the target remains unchanged
[4] Wait for 3408-3412 again, defend 3417, and target 3290
[5] Go short near 3430, defend 3437, and the target is to be determined
"Personal advice, for reference only" XAUUSD GOLD XAUUSD GOLD
Yesterday, spot gold rose by 100 US dollars, and the daily line closed with a huge positive line. Yesterday, we emphasized that the London session will not fall, and the rising pattern must be maintained. If the 3270 area is broken, the 3310-20 range can be bullish; the London session can only be long at a low level, and shorting needs to be in the US session. The market is consistent with expectations. The bulls remain long before the US session. After the European session breaks through the 3270-72 area, the bulls accelerate the rise. The US session 3328 line falls to 3305 at the maximum, stabilizes, and then rises and breaks the high.
After yesterday's 100+ surge, the bulls are strong and continue to be bullish. The only unfavorable factor for bulls at present is that the indicator is seriously overbought in the short term. The key position of the day supports the low point of yesterday's US market at 3305-3300, which is also the watershed between long and short positions in the day; the key position of the morning market is 3325-22 area, which is the watershed between long and short positions! Relying on the intraday and early trading long and short boundaries, the early trading upward impact of the upper edge of last week's oscillation range at 3360-70 will further bullishly fall under pressure near 3385. In the follow-up points, continue to pay attention to the break above 86 and pay attention to the area above 3410-40! The Asian market's rising pattern is broken or the watershed is broken, and the market is weak! In terms of operation, it is still mainly low and long during the day, and the short position in the US market will make a correction.
Market analysis:
① The three-track shrinkage of the daily Bollinger band represents the compression and oscillation of the range. The indicator macd dead cross shrinks, and the smart indicator sto quickly repairs upward, representing the current trend of oscillation and rebound. And the candle chart rushed up yesterday and stood firm on the MA5 and MA10 moving averages, so it will continue to rush up to test the upper rail*, but the upper rail will continue to move down over time. The upper* is currently at 3461-3480. The support moving average and the middle rail correspond to the 3309-3295-3274 line.
Currently, the daily short-term focus is on the previous gap high point 3386.5*, and the 3424 line.
②The 4-hour indicator is still running at a high level, representing the bulls of the price. Currently, the upper rail and the MA5 moving average support correspond to the 3368-3344 line. According to the Fibonacci retracement line obtained from this round of decline, the upper* is currently at the 0.618 position 3385 line.
③The hourly MACD and STO are both at relatively high levels and can face retracement at any time. The hourly line is currently supported around 3335-37, 3322-20 and 3310. Combined with the short-term cycle, the current upper support is at 3362-3355 and 3372.
In summary:
The daily line will continue to rebound and test the upper track*, that is, it will definitely break the 3386 line; but today 3386 is also the *point we need to pay attention to.
Because we see that the daily line will continue to rise, today's retracement will not exceed the morning low of 3323. Therefore, the retracement of 3272-78 will continue to be delayed, so the best point for long orders today is definitely 3335-37. At present, it is too far away, so we need to find 3355 and 3362 and the current 3372 line.
Therefore, today's long orders can be held above 3400, and as long as it breaks through 3385-87, it can be reached today.
Strategy:
[1] Short around 3385-86, stop loss at 3389, target at 3374-3364 (after breaking through 3386-87, go long around 3374-76, defense at 3368, target at 3370-3385-3400-10-30
[2] Go long around 3251-53, defense at 3345, target at 3370-3385-340 0-10-30 "You can enter the market at the first retracement, but not at the second retracement"
[3] Buy near 3330-35 during the day, defend 3320, and the target remains unchanged
[4] Wait for 3408-3412 again, defend 3417, and target 3290
[5] Go short near 3430, defend 3437, and the target is to be determined
"Personal advice, for reference only"
Trade active
Recently, the bull market has hit new highs. In this turbulent uptrend, have you successfully followed the trend and made huge profits, or have you run into obstacles on the road of investment? Fortunately, you have seen my article today. Regardless of past gains and losses, you can achieve investment breakthroughs with my help. David's accuracy rate has been at the top of the list for many years. I have the confidence and ability to lead you to follow us and win in this market!Trade closed: target reached
Congratulations to the core members for making considerable profits again. Many people have said, "David, I can't understand your thinking at all. Sometimes you stick to a trend, and sometimes you are very fickle." You must know that the market is changing all the time, and our operating ideas will also change with the changes in the market. A qualified analyst should have a sense of smell like a wolf, be able to seize fleeting opportunities, and issue early warnings in the face of danger. And all we do is to be able to shout out those stable orders so that you can make stable profits. And all we do is to be able to call out those stable orders so that you can make steady profits. If you have any questions about the market, you can leave a message to David.Continuously release precise trading plans to lead members to expand profits, with a stable profit of 988% every month. If you have not made a profit yet, then join us. t.me/fahsufnwks
Disclaimer
The information and publications are not meant to be, and do not constitute, financial, investment, trading, or other types of advice or recommendations supplied or endorsed by TradingView. Read more in the Terms of Use.
Continuously release precise trading plans to lead members to expand profits, with a stable profit of 988% every month. If you have not made a profit yet, then join us. t.me/fahsufnwks
Disclaimer
The information and publications are not meant to be, and do not constitute, financial, investment, trading, or other types of advice or recommendations supplied or endorsed by TradingView. Read more in the Terms of Use.