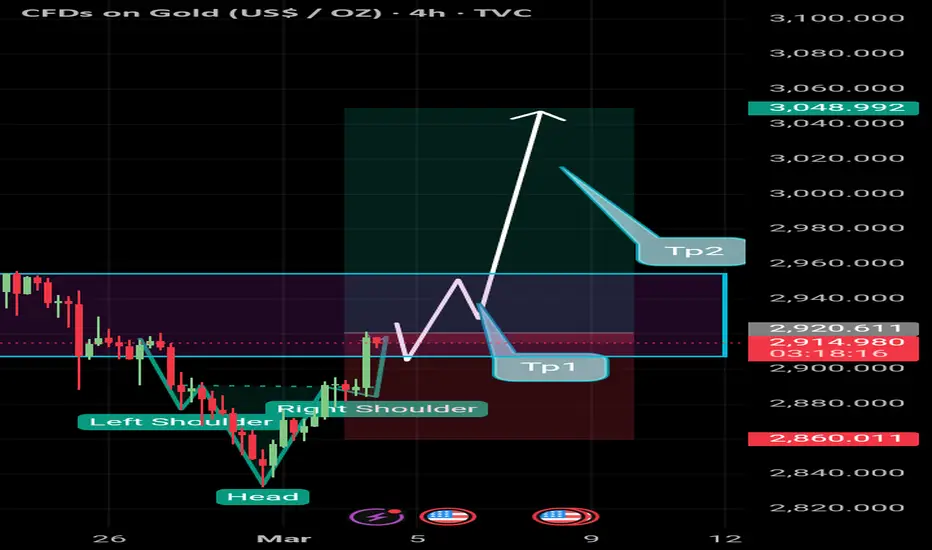
*$2920 Support Level:*
The gold price has found support at the $2920 level, which is a crucial technical level. This level has acted as a strong support in the past, and a bounce from this level could indicate a further upward move.
*Technical Analysis:*
From a technical perspective, the $2920 level is:
- *Confluence of Support:* The $2920 level is a confluence of support, where the 50-day and 100-day simple moving averages (SMAs) intersect. This makes it a strong support level.
- *Trend Line Support:* The $2920 level is also a trend line support, where the gold price has bounced multiple times in the past.
- *Oscillator Support:* The oscillators, such as the Relative Strength Index (RSI) and the Moving Average Convergence Divergence (MACD), are also showing signs of support at this level.
*Potential Upward Move:*
If the gold price bounces from the $2920 support level, it could indicate a further upward move. The potential targets for this move could be:
- *$3000 Level:* The $3000 level is a strong resistance level, and a break above this level could indicate a bullish reversal.
- *$3050 Level:* The $3050 level is another strong resistance level, and a break above this level could indicate a further upward move.
- *Higher Highs:* If the gold price breaks above the $3050 level, it could indicate a trend reversal, and the price could make higher highs.
Remember us in best wishes 👍
Trade active
Trade closed manually
Disclaimer
The information and publications are not meant to be, and do not constitute, financial, investment, trading, or other types of advice or recommendations supplied or endorsed by TradingView. Read more in the Terms of Use.
Disclaimer
The information and publications are not meant to be, and do not constitute, financial, investment, trading, or other types of advice or recommendations supplied or endorsed by TradingView. Read more in the Terms of Use.