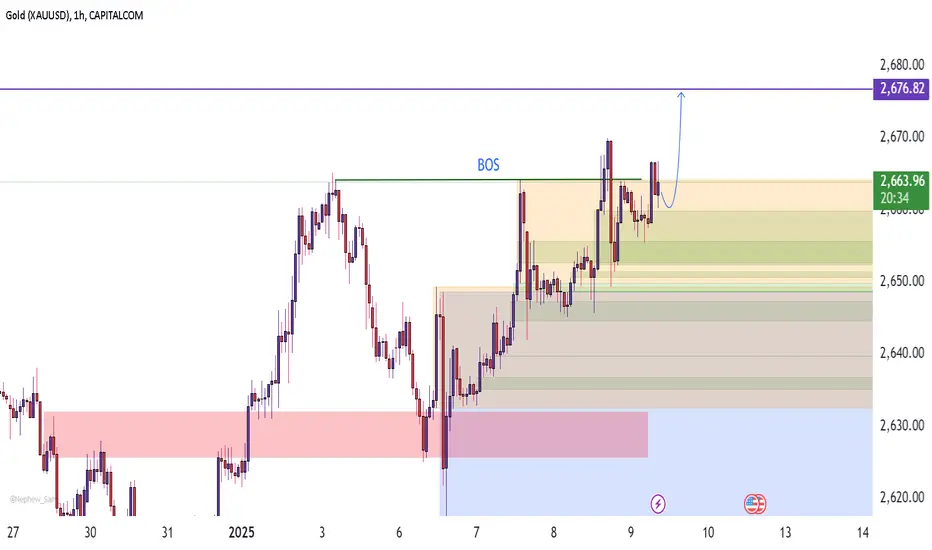
From the provided chart:
1. **Break of Structure (BOS):** The market recently broke above a key level, indicating bullish momentum.
2. **Support Zone:** Price is currently retesting a demand zone (highlighted in light orange) near 2660, showing signs of a potential bounce.
3. **Target Area:** The purple line at 2676.82 marks the next resistance or target level. A continuation of the bullish trend may aim for this level.
4. **Trade Setup:** The blue arrow suggests a likely move upward if the demand zone holds, confirming the retest.
**Conclusion:** Wait for confirmation of support around the current zone (2660-2664) before entering a long trade, with a target of 2676.82. A failure to hold this support could lead to further downside testing.
Trade closed: target reached
Target achieved👍👉JOIN MY TELEGRAM:
Free Signals And Technical Chart:
t.me/+JLFlD0eg3LFjNjU8
📞TELEGRAM ME
@t.me/daniel9145
Free Signals And Technical Chart:
t.me/+JLFlD0eg3LFjNjU8
📞TELEGRAM ME
@t.me/daniel9145
Disclaimer
The information and publications are not meant to be, and do not constitute, financial, investment, trading, or other types of advice or recommendations supplied or endorsed by TradingView. Read more in the Terms of Use.
👉JOIN MY TELEGRAM:
Free Signals And Technical Chart:
t.me/+JLFlD0eg3LFjNjU8
📞TELEGRAM ME
@t.me/daniel9145
Free Signals And Technical Chart:
t.me/+JLFlD0eg3LFjNjU8
📞TELEGRAM ME
@t.me/daniel9145
Disclaimer
The information and publications are not meant to be, and do not constitute, financial, investment, trading, or other types of advice or recommendations supplied or endorsed by TradingView. Read more in the Terms of Use.