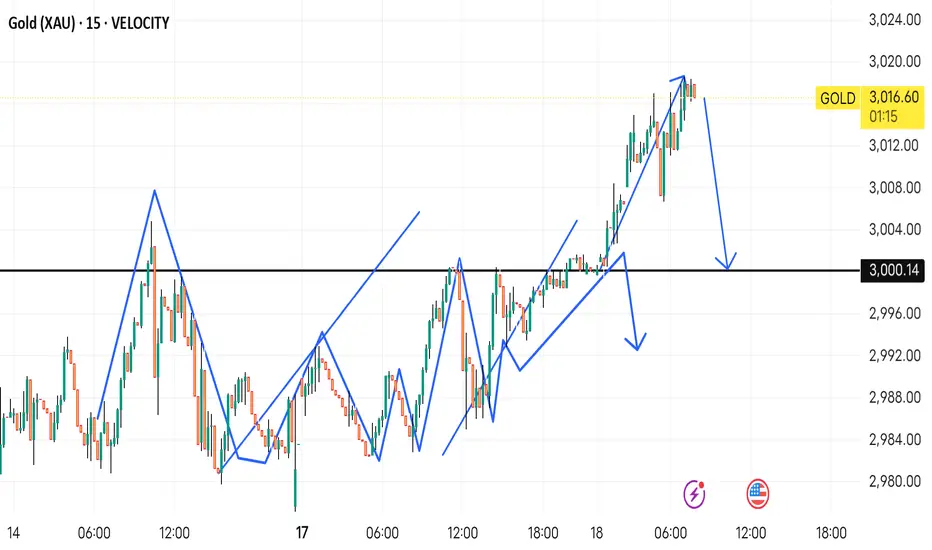
This chart is a 15-minute Gold (XAU/USD) price analysis with a technical pattern projection.
Key Observations:
1. Support & Resistance:
A strong horizontal support level is marked at $3,000.14.
Price recently peaked near $3,016.13 and is showing signs of a potential reversal.
2. Price Structure & Pattern:
The blue lines indicate wave-like price movements, possibly an Elliott Wave or price action structure.
The pattern suggests that the market previously experienced a strong bullish impulse, but now a retracement is expected.
3. Projected Movement:
The downward arrows suggest a bearish correction towards $3,000.14, which could act as a key support zone.
If price respects this support, a potential bounce-back might occur. Otherwise, a breakdown could lead to further declines.
Possible Trading Plan:
Short Setup: If price starts rejecting resistance near $3,016 and forms bearish confirmation (e.g., candlestick patterns like engulfing or pin bars).
Buy Opportunity: If price reaches $3,000.14 and shows strong support confirmation (like a bullish engulfing or double bottom).
Would you like a more detailed trading plan based on this setup?
World Best Signals Channel here 🤝
✅ XAUUSD Gold
✅ BTC & other coins
✅ EURUSD
✅ USDJPY
✅ GBPUSD
✅ ETH USD
Telegram channel 👇👇
t.me/+QYl1pO28OrY0ZTU0
✅ XAUUSD Gold
✅ BTC & other coins
✅ EURUSD
✅ USDJPY
✅ GBPUSD
✅ ETH USD
Telegram channel 👇👇
t.me/+QYl1pO28OrY0ZTU0
Disclaimer
The information and publications are not meant to be, and do not constitute, financial, investment, trading, or other types of advice or recommendations supplied or endorsed by TradingView. Read more in the Terms of Use.