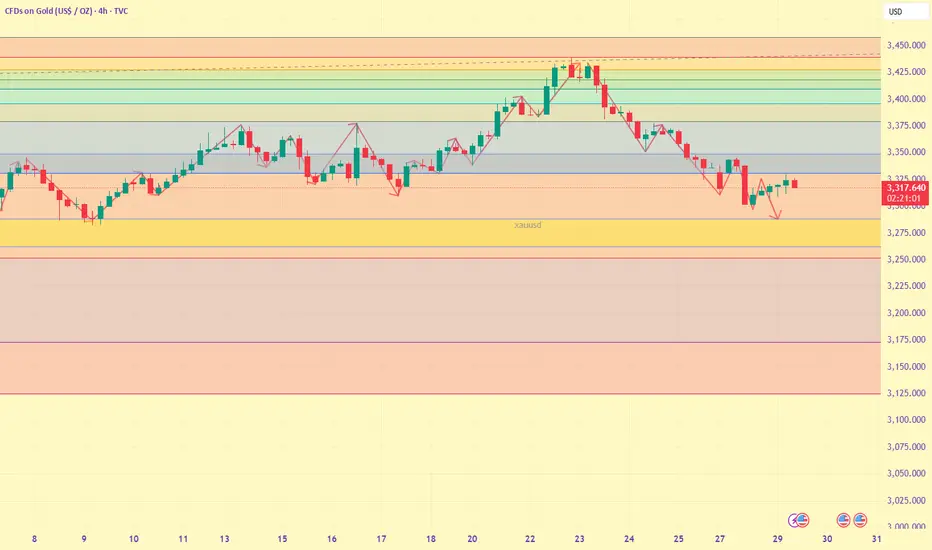
The daily chart shows that gold prices still face downside risks after breaking below the key rising trend line support level of $3,352. The 14-day RSI, currently near 45, is below its midline, confirming its downside potential. However, gold could retest $3,300. A break below this level would target the July 9 low of $3,283.
On the other hand, a daily close above the strong support-turned-resistance level near $3,345 would be crucial for initiating a meaningful rebound. This level marks the intersection of ascending trendline resistance, the 20-day moving average, and the 50-day moving average. Further upward resistance lies near the static resistance level of $3,377, which, if broken, could potentially lead to a move towards $3,400.
Good at solving all trading problems, doubling the account in a week, and making a stable profit of 300% in a month
🚀Private VIP: t.me/HenryDovitt
👍Market exclusive signal: t.me/Henryffjyfylffc108
🚀Private VIP: t.me/HenryDovitt
👍Market exclusive signal: t.me/Henryffjyfylffc108
Disclaimer
The information and publications are not meant to be, and do not constitute, financial, investment, trading, or other types of advice or recommendations supplied or endorsed by TradingView. Read more in the Terms of Use.