🔍 XAU/USD (Gold) Technical Analysis – 30-Min Chart
🟦 Trend Overview:
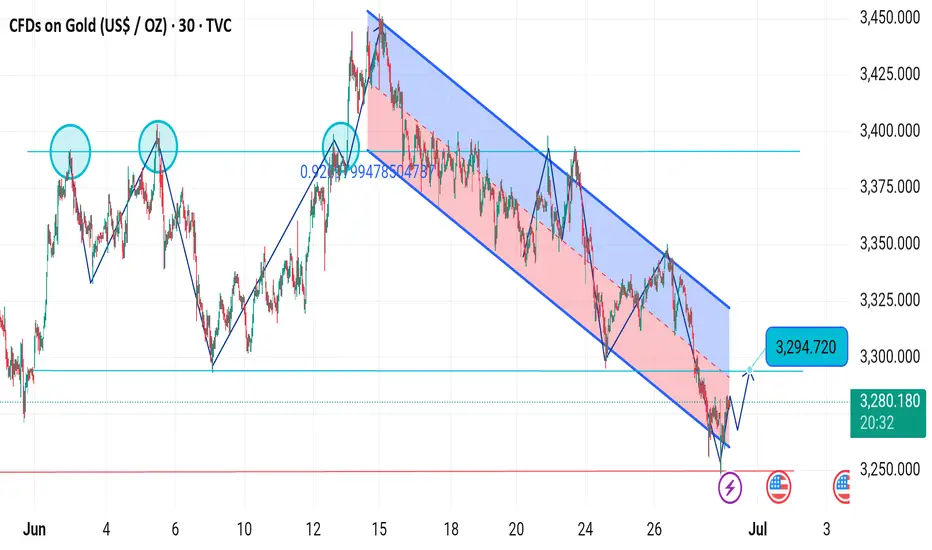
The chart shows a clear descending channel (highlighted in red and blue), indicating a short-term bearish trend.
Gold price touched the channel bottom and is now showing signs of bullish reversal.
🔄 Pattern & Key Observations:
Triple Top Formation (circled in blue) around the 3,390–3,400 zone, followed by strong sell-offs.
Price respected the channel boundaries, making lower highs and lower lows until the recent breakout attempt.
📈 Current Move:
Recent bullish candles at the channel bottom suggest a reversal attempt.
A breakout from the descending channel is underway, aiming for the resistance at 3,294.
🎯 Targets & Levels:
Immediate Resistance (Target): 3,294
Support Zone: 3,245–3,250
Breakout Confirmation: Sustained price above 3,294 may lead toward 3,320+
🧠 Conclusion:
If momentum holds, gold may continue a short-term bullish retracement to 3,294.
Watch for a confirmed breakout and volume to support further upside.
🟦 Trend Overview:
The chart shows a clear descending channel (highlighted in red and blue), indicating a short-term bearish trend.
Gold price touched the channel bottom and is now showing signs of bullish reversal.
🔄 Pattern & Key Observations:
Triple Top Formation (circled in blue) around the 3,390–3,400 zone, followed by strong sell-offs.
Price respected the channel boundaries, making lower highs and lower lows until the recent breakout attempt.
📈 Current Move:
Recent bullish candles at the channel bottom suggest a reversal attempt.
A breakout from the descending channel is underway, aiming for the resistance at 3,294.
🎯 Targets & Levels:
Immediate Resistance (Target): 3,294
Support Zone: 3,245–3,250
Breakout Confirmation: Sustained price above 3,294 may lead toward 3,320+
🧠 Conclusion:
If momentum holds, gold may continue a short-term bullish retracement to 3,294.
Watch for a confirmed breakout and volume to support further upside.
Trade closed: target reached
Enjoy your trades target reached 100%🔗 t.me/+VTrdWh5R_scwMGM0
✅ All PAIRS SIGNALS PROVIDE FIRST VISIT THEN JOIN
🔗 t.me/+jODseb0iIvxiNjc0
✅ REGISTER UNDER THE WORLD BEST BROKER
🔗 one.exnesstrack.org/a/6yzdfvn1po
✅ All PAIRS SIGNALS PROVIDE FIRST VISIT THEN JOIN
🔗 t.me/+jODseb0iIvxiNjc0
✅ REGISTER UNDER THE WORLD BEST BROKER
🔗 one.exnesstrack.org/a/6yzdfvn1po
Disclaimer
The information and publications are not meant to be, and do not constitute, financial, investment, trading, or other types of advice or recommendations supplied or endorsed by TradingView. Read more in the Terms of Use.
🔗 t.me/+VTrdWh5R_scwMGM0
✅ All PAIRS SIGNALS PROVIDE FIRST VISIT THEN JOIN
🔗 t.me/+jODseb0iIvxiNjc0
✅ REGISTER UNDER THE WORLD BEST BROKER
🔗 one.exnesstrack.org/a/6yzdfvn1po
✅ All PAIRS SIGNALS PROVIDE FIRST VISIT THEN JOIN
🔗 t.me/+jODseb0iIvxiNjc0
✅ REGISTER UNDER THE WORLD BEST BROKER
🔗 one.exnesstrack.org/a/6yzdfvn1po
Disclaimer
The information and publications are not meant to be, and do not constitute, financial, investment, trading, or other types of advice or recommendations supplied or endorsed by TradingView. Read more in the Terms of Use.