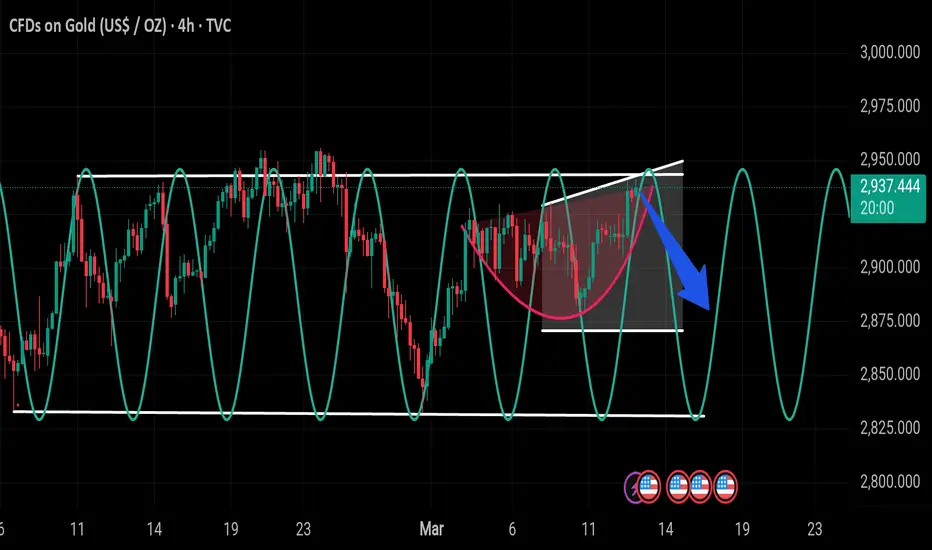
Gold (XAU/USD) on the 4H chart is forming a rising wedge, which is a bearish pattern. The price is near resistance at $2,960, and support is around $2,900.
The blue arrow suggests a potential drop, meaning if gold breaks below $2,900, it could fall to $2,850 - $2,820. If it breaks above $2,960, it may continue higher. Watch for confirmation before entering a trade.
The blue arrow suggests a potential drop, meaning if gold breaks below $2,900, it could fall to $2,850 - $2,820. If it breaks above $2,960, it may continue higher. Watch for confirmation before entering a trade.
Disclaimer
The information and publications are not meant to be, and do not constitute, financial, investment, trading, or other types of advice or recommendations supplied or endorsed by TradingView. Read more in the Terms of Use.
Disclaimer
The information and publications are not meant to be, and do not constitute, financial, investment, trading, or other types of advice or recommendations supplied or endorsed by TradingView. Read more in the Terms of Use.