📉 Gold Price Disruption Analysis – 1H Chart
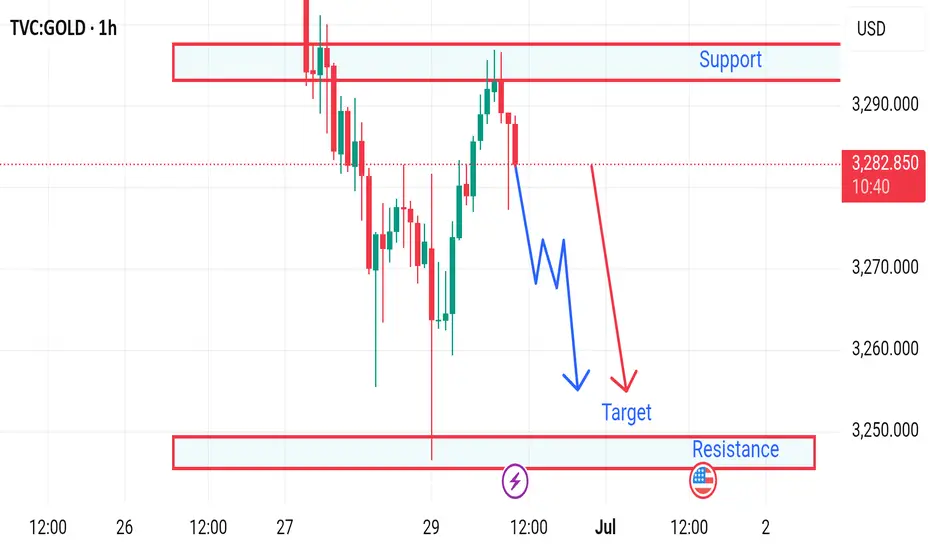
Current Price: $3,282.880
Timeframe: 1-Hour
Trend Direction: Bearish bias with possible continuation toward $3,250
---
🔻 Bearish Scenario (Planned Path):
Support Turned Resistance: The area around $3,290 acted as strong resistance (previous support). Price failed to break above.
Lower High Formation: Price has created a lower high, indicating potential continuation to the downside.
Projected Target: A zigzag downward move is expected, with a target near $3,250, aligning with a key demand/support zone.
---
⚠️ Disruption Possibilities (Unexpected Movements):
🔁 1. Bullish Disruption Risk:
If buyers step in aggressively above $3,283–$3,285, we may see:
A break of structure
A reversal toward the $3,290+ zone
Possible formation of a double bottom or inverse head and shoulders
Disruption Target: $3,295–$3,300
🧨 2. False Breakdown at Support ($3,250):
Market could dip slightly below $3,250 to trap sellers and then reverse sharply.
A liquidity grab might lead to sudden bullish pressure, creating a disruption bounce.
📊 3. Fundamental Disruption Factors:
US Dollar strength/weakness
Fed interest rate news
Inflation data releases
These can instantly invalidate technical patterns and push price in either direction.
Disclaimer
The information and publications are not meant to be, and do not constitute, financial, investment, trading, or other types of advice or recommendations supplied or endorsed by TradingView. Read more in the Terms of Use.
Disclaimer
The information and publications are not meant to be, and do not constitute, financial, investment, trading, or other types of advice or recommendations supplied or endorsed by TradingView. Read more in the Terms of Use.