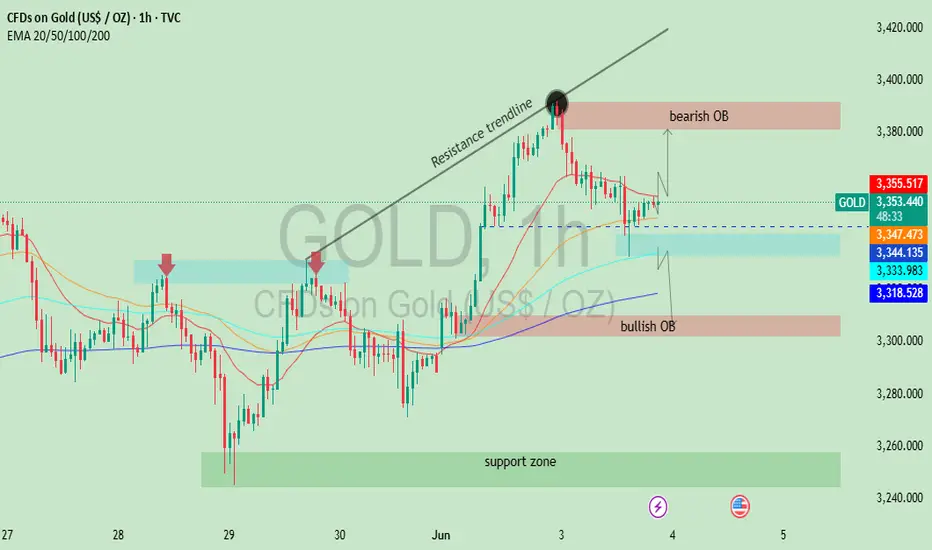
This chart shows the 1-hour (1H) price action for **Gold (XAU/USD)** as of **June 3, 2025**. It incorporates key technical indicators and price zones relevant for short-term trading or analysis. Here's a detailed breakdown:
---
### 📈 **Chart Components and Analysis**
#### 1. **Trendline & Price Action**
* A **resistance trendline** is drawn connecting recent higher highs, indicating a bearish breakout when price rejected the upper trend.
* Price spiked above the trendline briefly but sharply reversed from a key area, suggesting **strong seller pressure** near the recent highs (\~\$3,400).
#### 2. **Order Blocks (OBs)**
* **Bearish OB (Order Block)**: Located just below the \$3,400 level. This zone marks a strong supply area where institutional selling likely occurred, leading to the recent drop.
* **Bullish OB**: Around the \$3,320–\$3,340 zone. This represents a demand area where buyers previously stepped in, possibly creating a support base.
#### 3. **Support Zone**
* A **broad support zone** is shown in green between approximately **\$3,250 and \$3,270**.
* This zone was tested previously and held firm, suggesting potential for bullish activity if price retraces deeply.
#### 4. **Moving Averages (EMA 20/50/100/200)**
* The EMAs are color-coded:
* **20 EMA**: \$3,355.466 (red)
* **50 EMA**: \$3,347.451 (orange)
* **100 EMA**: \$3,333.973 (cyan)
* **200 EMA**: \$3,318.522 (blue)
* Price is currently trading between the 20 and 50 EMA, indicating a potential decision point (either breakout or pullback).
#### 5. **Price Scenarios**
* Two potential scenarios are drawn with arrows:
* **Bullish Scenario**: Price bounces from the blue highlighted zone (minor demand) and targets the bearish OB.
* **Bearish Scenario**: Price breaks down through the minor support and heads toward the **bullish OB** or **support zone**.
---
### 🧭 **Trading Implication**
* **Short-term Bias**: Neutral to Bearish unless price reclaims and holds above \$3,355 (20 EMA).
* **Key Levels to Watch**:
* Resistance: \$3,380–\$3,400 (bearish OB)
* Support: \$3,340–\$3,320 (bullish OB), then deeper at \$3,250–\$3,270
---
Would you like this analysis updated for future movements, or should I generate trading signals based on this setup?
---
### 📈 **Chart Components and Analysis**
#### 1. **Trendline & Price Action**
* A **resistance trendline** is drawn connecting recent higher highs, indicating a bearish breakout when price rejected the upper trend.
* Price spiked above the trendline briefly but sharply reversed from a key area, suggesting **strong seller pressure** near the recent highs (\~\$3,400).
#### 2. **Order Blocks (OBs)**
* **Bearish OB (Order Block)**: Located just below the \$3,400 level. This zone marks a strong supply area where institutional selling likely occurred, leading to the recent drop.
* **Bullish OB**: Around the \$3,320–\$3,340 zone. This represents a demand area where buyers previously stepped in, possibly creating a support base.
#### 3. **Support Zone**
* A **broad support zone** is shown in green between approximately **\$3,250 and \$3,270**.
* This zone was tested previously and held firm, suggesting potential for bullish activity if price retraces deeply.
#### 4. **Moving Averages (EMA 20/50/100/200)**
* The EMAs are color-coded:
* **20 EMA**: \$3,355.466 (red)
* **50 EMA**: \$3,347.451 (orange)
* **100 EMA**: \$3,333.973 (cyan)
* **200 EMA**: \$3,318.522 (blue)
* Price is currently trading between the 20 and 50 EMA, indicating a potential decision point (either breakout or pullback).
#### 5. **Price Scenarios**
* Two potential scenarios are drawn with arrows:
* **Bullish Scenario**: Price bounces from the blue highlighted zone (minor demand) and targets the bearish OB.
* **Bearish Scenario**: Price breaks down through the minor support and heads toward the **bullish OB** or **support zone**.
---
### 🧭 **Trading Implication**
* **Short-term Bias**: Neutral to Bearish unless price reclaims and holds above \$3,355 (20 EMA).
* **Key Levels to Watch**:
* Resistance: \$3,380–\$3,400 (bearish OB)
* Support: \$3,340–\$3,320 (bullish OB), then deeper at \$3,250–\$3,270
---
Would you like this analysis updated for future movements, or should I generate trading signals based on this setup?
Trade closed: target reached
Target Achieved:The downward movement from the resistance zone to the support zone suggests that the short-term target mentioned in the title—"Eyes on Support Zone"—has been successfully achieved.
Disclaimer
The information and publications are not meant to be, and do not constitute, financial, investment, trading, or other types of advice or recommendations supplied or endorsed by TradingView. Read more in the Terms of Use.
Disclaimer
The information and publications are not meant to be, and do not constitute, financial, investment, trading, or other types of advice or recommendations supplied or endorsed by TradingView. Read more in the Terms of Use.