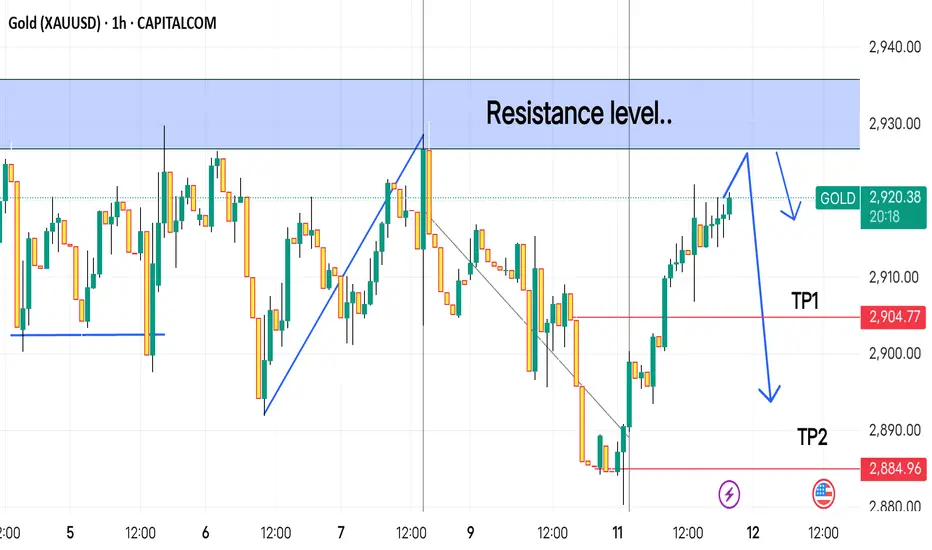
This is a technical analysis chart for Gold (XAU/USD) on the 1-hour timeframe, published on TradingView. Here’s what it suggests:
1. Resistance Level (Blue Zone):
The price is approaching a key resistance area around $2,930.
This level has been tested before and could act as a strong barrier.
2. Potential Reversal Setup (Blue Arrow):
The chart suggests that gold may reverse down from this resistance.
A downward arrow indicates a possible short (sell) trade setup.
3. Take Profit (TP) Targets:
TP1 (First Target): Around $2,904.77
TP2 (Second Target): Around $2,884.96
These levels are where traders might consider closing their short positions.
4. Price Action & Trend Analysis:
The price previously formed a descending channel (red and blue shaded area).
It has now broken out of that channel and is testing the resistance.
Conclusion:
This chart suggests a potential sell opportunity if the price respects the resistance. If gold gets rejected at this level, it could
Disclaimer
The information and publications are not meant to be, and do not constitute, financial, investment, trading, or other types of advice or recommendations supplied or endorsed by TradingView. Read more in the Terms of Use.
Disclaimer
The information and publications are not meant to be, and do not constitute, financial, investment, trading, or other types of advice or recommendations supplied or endorsed by TradingView. Read more in the Terms of Use.