🟠 Chart 1: Traditional Pivots with MACD

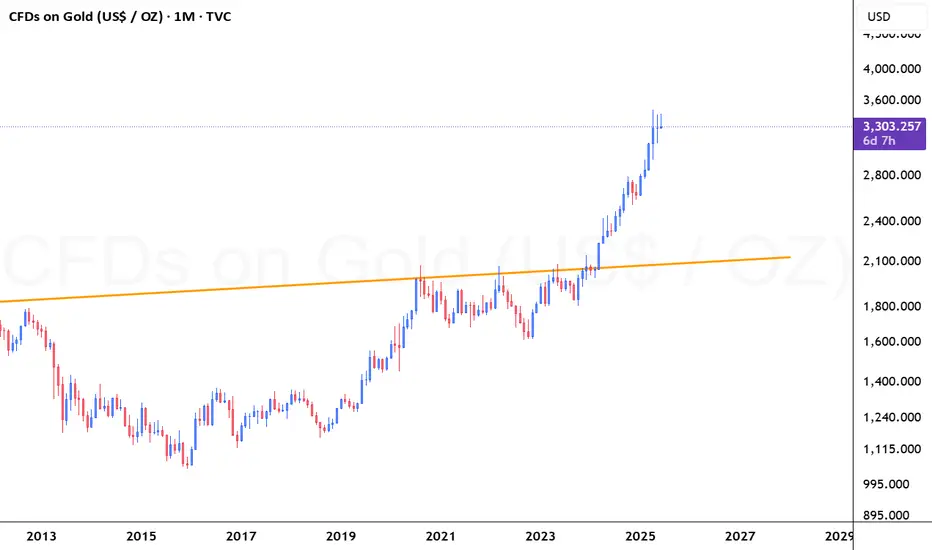
Price Action: Gold is showing signs of consolidation below the resistance zone near Q-R1 (3295.657) and R2 (3468.343).
MACD Indicator: There is a clear bearish crossover in the MACD histogram and lines, suggesting weakening bullish momentum.
Trendline Support: Price is still above the long-term trendline, but any break below 3200 may accelerate the downside.
Volume: Currently no volume spike to suggest strong buying interest.
Bearish Signals:
MACD rollover.
Repeated rejection near resistance zone.
Lower highs forming.
🟢 Chart 2: Camarilla Pivots with EMA Cloud/b]

Camarilla Levels:
H3 (3264.077) is labeled as a "Sell Reversal."
L3 (2981.863) as "Buy Reversal" and L4 (2840.757) as "Breakout."
EMA Cloud: Price is above the cloud but getting compressed. If the price breaks and sustains below the cloud (around 3100–3150), it confirms a bearish shift.
Candle Formation: Recent weekly candles are rejecting the upside—indicating distribution.
Bearish Bias Support:
Price failing to break H4 (3405).
Compression below key resistance with potential drop to L3/L4.
🔵 Chart 3: Money Zone

Value Area High (VAH): ~3036
Point of Control (POC): ~2877
MZ VAL: ~2720
Price is above VAH but weakening. If it breaks down below 3036, it may retest the POC (~2877) and VAL (~2720).
Volume Analysis:
A low-volume node around 3150–3250 suggests the price may fall fast if it breaks.
Major support comes near 2877 and 2720.
✅ Conclusion (Bearish Case Validation):
You have solid technical confirmation for a bearish bias:
MACD bearish divergence.
Repeated failure at Camarilla resistance.
EMA cloud tightening with potential breakdown.
Price is trading above value zones with signs of exhaustion.
Volume profile supports a sharp drop if 3200–3150 is broken.
Price Action: Gold is showing signs of consolidation below the resistance zone near Q-R1 (3295.657) and R2 (3468.343).
MACD Indicator: There is a clear bearish crossover in the MACD histogram and lines, suggesting weakening bullish momentum.
Trendline Support: Price is still above the long-term trendline, but any break below 3200 may accelerate the downside.
Volume: Currently no volume spike to suggest strong buying interest.
Bearish Signals:
MACD rollover.
Repeated rejection near resistance zone.
Lower highs forming.
🟢 Chart 2: Camarilla Pivots with EMA Cloud/b]
Camarilla Levels:
H3 (3264.077) is labeled as a "Sell Reversal."
L3 (2981.863) as "Buy Reversal" and L4 (2840.757) as "Breakout."
EMA Cloud: Price is above the cloud but getting compressed. If the price breaks and sustains below the cloud (around 3100–3150), it confirms a bearish shift.
Candle Formation: Recent weekly candles are rejecting the upside—indicating distribution.
Bearish Bias Support:
Price failing to break H4 (3405).
Compression below key resistance with potential drop to L3/L4.
🔵 Chart 3: Money Zone
Value Area High (VAH): ~3036
Point of Control (POC): ~2877
MZ VAL: ~2720
Price is above VAH but weakening. If it breaks down below 3036, it may retest the POC (~2877) and VAL (~2720).
Volume Analysis:
A low-volume node around 3150–3250 suggests the price may fall fast if it breaks.
Major support comes near 2877 and 2720.
✅ Conclusion (Bearish Case Validation):
You have solid technical confirmation for a bearish bias:
MACD bearish divergence.
Repeated failure at Camarilla resistance.
EMA cloud tightening with potential breakdown.
Price is trading above value zones with signs of exhaustion.
Volume profile supports a sharp drop if 3200–3150 is broken.
Note
Gold prices declined by over 3% last week, while silver remained mostly flat. Technically, gold formed a triple top near $3,430-$3,450 and has since declined. It may find support near $3,280, but a clear breach could push prices down to $3,200. On MCX, gold may trade in the range of Rs. 93,800–Rs. 98,200.
Disclaimer
The information and publications are not meant to be, and do not constitute, financial, investment, trading, or other types of advice or recommendations supplied or endorsed by TradingView. Read more in the Terms of Use.
Disclaimer
The information and publications are not meant to be, and do not constitute, financial, investment, trading, or other types of advice or recommendations supplied or endorsed by TradingView. Read more in the Terms of Use.